10 Metrics Dividend Investors Need to Know презентация
Содержание
- 2. There are hundreds of possible metrics you can use to evaluate
- 3. 1. Payout ratio A stock’s payout ratio is a measurement of
- 4. As a general rule, I like to see payout ratios that
- 5. 2. Dividend yield Surprisingly, dividend yield is possibly the least important
- 6. It’s also worth noting that, because dividend yield depends on the
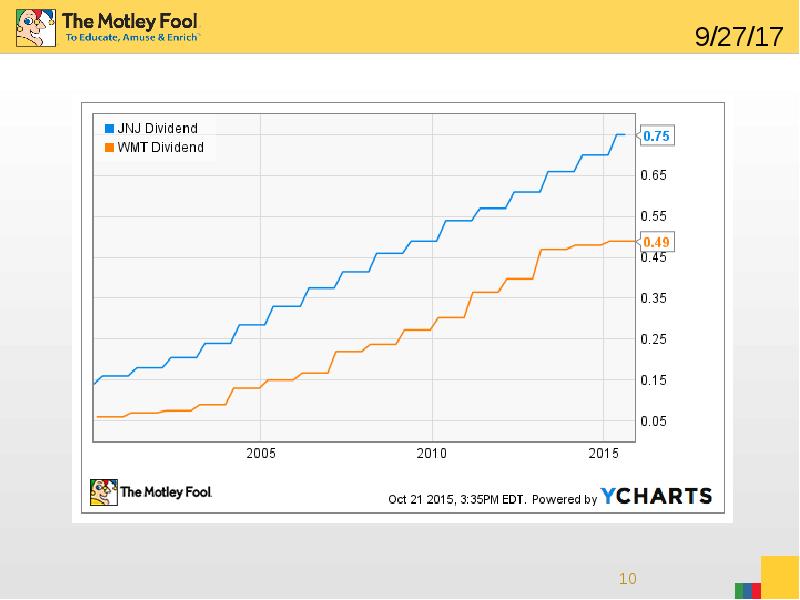
- 7. 3. Dividend history and growth One of the most important factors
- 8. Two examples Let’s look at two of my favorite dividend stocks
- 9. Two examples Wal-Mart has a dividend yield of 3.33%, and a
- 11. 4. Interest coverage Also known as “debt coverage,” this metric tells
- 12. Interest coverage tells us whether a company will be able to
- 13. 5. Total return A stock’s dividend is only one part of
- 14. Wal-Mart and Johnson & Johnson have produced average annual total returns
- 15. 6. EPS and revenue growth A strong history of earnings and
- 16. 7. P/E ratio Perhaps the most widely used valuation metric, a
- 17. 8. Share buybacks There are two main ways a company can
- 18. Many investors actually prefer share buybacks to dividends. Dividends paid to
- 19. 9. Beta When choosing dividend stocks for the long term, you
- 20. Johnson & Johnson has a beta of 0.6, meaning it is
- 21. 10. Return on equity (ROE) Return on equity, or ROE, is
- 22. Wal-Mart has a ROE (TTM) of 19.78%, superior to its industry’s
- 23. The simple trick that can add $15,978 to your Social SecurityCLICK
- 24. Скачать презентацию


Return on equity, or ROE, is")
 of 19.78%, superior to its industry’s")

Слайды и текст этой презентации
Слайд 1
Описание слайда:
Слайд 2
Описание слайда:
There are hundreds of possible metrics you can use to evaluate a stock.
But, some are more important than others.
For dividend stocks, here are 10 of the most important metrics you can use to make informed investment decisions.
Слайд 3
Описание слайда:
1. Payout ratio
A stock’s payout ratio is a measurement of its dividend payment as a percentage of its earnings.
A relatively low payout ratio indicates that the company has lots of room to increase its dividend in the future.
It also shows a stock’s ability to continue its dividend payments if times get tough.
Слайд 4
Описание слайда:
As a general rule, I like to see payout ratios that are below 60%, but there are some exceptions.
For example, real estate investment trusts (REITs) are required to pay out at least 90% of their income, so a high payout ratio isn’t a sign of trouble in this case.
Слайд 5
Описание слайда:
2. Dividend yield
Surprisingly, dividend yield is possibly the least important metric on this list.
Just because a stock’s dividend yield is high doesn’t make it a good investment.
However, if all of a stock’s other metrics look good, a higher dividend yield can be an advantage.
Слайд 6
Описание слайда:
It’s also worth noting that, because dividend yield depends on the current share price, yields can rise significantly when the market drops.
So, in corrections and market crashes, it may be a good time to lock in higher yields on your favorite dividend stocks.
Слайд 7
Описание слайда:
3. Dividend history and growth
One of the most important factors when choosing a dividend stock for the long term is consistency.
Does the stock pay a dividend every year without fail?
Does the stock have a strong history of increasing its dividend?
Слайд 8
Описание слайда:
Two examples
Let’s look at two of my favorite dividend stocks to illustrate the metrics we’ve discussed so far – Wal-Mart (WMT) and Johnson & Johnson (JNJ).
Слайд 9
Описание слайда:
Two examples
Wal-Mart has a dividend yield of 3.33%, and a strong 41% payout ratio. The company has increased its dividend for 40 years in a row.
Johnson & Johnson pays a slightly lower 3.05% yield and has a 57% payout ratio – and has increased its dividend for 52 consecutive years. In other words, the last time Johnson & Johnson shareholders didn’t get a dividend increase was in the early 1960s!
Слайд 10
Описание слайда:
Слайд 11
Описание слайда:
4. Interest coverage
Also known as “debt coverage,” this metric tells us how easy it is for a company to pay its debts.
For example, an interest coverage ratio of 4.0:1 means that for every $1 in interest owed, the company earns $4.
Слайд 12
Описание слайда:
Interest coverage tells us whether a company will be able to pay its debts and continue its dividend if profits drop.
For example, Wal-Mart has interest coverage of 11.2:1, meaning that only a small percentage of its profits are used for paying debts, so the company could absorb a large profit decline relatively easily.
Слайд 13
Описание слайда:
5. Total return
A stock’s dividend is only one part of an investment’s performance.
Total return incorporates both dividend yield and share price appreciation.
Слайд 14
Описание слайда:
Wal-Mart and Johnson & Johnson have produced average annual total returns of 10.1% and 10.7% over the past 20 years.
To put this in perspective, if you had invested $10,000 in each of these stocks in 1995, you would have nearly $125,000 today!
Слайд 15
Описание слайда:
6. EPS and revenue growth
A strong history of earnings and revenue growth is a good indicator of a rising dividend.
Ideally, a company’s earnings and revenue will grow at approximately the same rate, as you can see is the case with Wal-Mart
Слайд 16
Описание слайда:
7. P/E ratio
Perhaps the most widely used valuation metric, a P/E ratio is most useful for comparing companies in similar industries.
The P/E is a measurement of how much a company’s stock costs in relation to its earnings
Слайд 17
Описание слайда:
8. Share buybacks
There are two main ways a company can return capital to shareholders: dividends and share buybacks.
Many of the most solid dividend stocks also have large share repurchase programs.
Слайд 18
Описание слайда:
Many investors actually prefer share buybacks to dividends.
Dividends paid to investors are taxed; however, buybacks are not, even though they both represent a return of capital.
Plus, most long-term investors reinvest their dividends anyway.
Слайд 19
Описание слайда:
9. Beta
When choosing dividend stocks for the long term, you certainly don’t want ultra-volatile stocks that dive and skyrocket with every market movement.
A stock’s beta is a measurement of volatility.
Specifically, it compares a stock’s volatility to that of the S&P 500.
Слайд 20
Описание слайда:
Johnson & Johnson has a beta of 0.6, meaning it is 60% as reactive to market movements as the S&P 500.
So, if the S&P drops by 10%, your shares of Johnson & Johnson can be expected to fall by approximately 6%
Слайд 21
Описание слайда:
10. Return on equity (ROE)
Return on equity, or ROE, is the amount of profit a company earns as a percentage of shareholders’ equity.
A high ROE may indicate that a company has pricing power over its competition, or some other competitive advantage.
Слайд 22
Описание слайда:
Wal-Mart has a ROE (TTM) of 19.78%, superior to its industry’s average of 17.65%.
This indicates that Wal-Mart generates profits more effectively than its competitors because of its competitive advantages. In Wal-Mart’s case, its main advantage is its size.
Слайд 23
Описание слайда:
The simple trick that can add $15,978 to your Social SecurityCLICK HERE TO READ NOW
Скачать презентацию на тему 10 Metrics Dividend Investors Need to Know можно ниже: