International Trade : Theory and Policy презентация
Содержание
- 2. Activities and evaluation criteria Activities within the course Lectures – 36
- 3. References Required Markusen J.R., Melvin J.R., Kaempfer W.H., Maskus K.E. (1995)
- 4. Part I. General equilibrium in closed and open economies Topic 1.
- 5. Topic 1. Issues of modern International Trade Theory. Technical concepts of
- 6. 1.1. Russia and the other countries: GDP per capita as a
- 7. 1.1. Russia: main economic indicators Source: International Trade Center, 2009
- 8. 1.1. Openness of an economy What is openness of an economy?
- 9. Relation between openness and economic development (for groups of countries)
- 10. Principal exporters and importers of goods, 2006 (bln $US and %)
- 11. Indicators of economic openness – example 1 International trade quota (Кitd)
- 12. Gains from openness i.e. arguments for economic openness (1) Access to
- 13. Indicators of comparative economic advantages - example 2 RCAIij (1) for
- 14. Indicators of comparative economic advantages - example 3 RCAIij (1) for
- 15. Indicators of comparative economic advantages - example 4 RCAIij (2) for
- 16. Indicators of comparative economic advantages – example 5 RCAIij (2) for
- 17. Specific features of non-monetary international economics Approach in the framework of
- 19. Main macroeconomic indicators of the Russian economy (% to the respective
- 20. Dynamics of Russian export (with seasonal correction, 1st quarter of 1994
- 21. Why did the volumes of international trade grow? Two waves
- 22. What kind of changes occur in international trade? Why?
- 25. Changes in international trade. XX-XXI centuries Growth in volumes of
- 26. Manufacturing intra-industry trade as a percentage of total manufacturing trade
- 27. Main issues of International Trade Theory and Policy Which countries have
- 28. Main issues of International Trade Theory and Policy Newton’s gravity law:
- 30. Models with heterogeneous firms* Models with heterogeneous firms*
- 31. Structure of International Trade Theory and Policy (1) Theories of International
- 32. Main issues of International Trade Theory and Policy. Trade How is
- 33. 1.2. The model of general equilibrium in production sector Exogenous parameters:
- 34. 1.2. Characteristics of production function General characteristics of production functions: Substitution
- 35. 1.2. Characteristics of production function - continued Specific features of the
- 36. 1.2. Concept of Pareto-efficiency in production sector Pareto-efficiency in production sector:
- 37. 1.2. Algebraic solution of general equilibrium model in production sector Algebraic
- 38. 1.2. Graphical illustration of general equilibrium in production sector Graphical illustration
- 39. 1.3. Interrelation between technology and production possibility curve Properties of
- 40. Homework: Homework: Exercise session 1 Some references (please see details in
- 41. Скачать презентацию


")


")
")
")
 Access to")
")
 for")
 for")
 for")


 Theories of International")


Слайды и текст этой презентации
Слайд 1
Описание слайда:
International Trade:
Theory and Policy
Lecture 1
September, 2016
Instructor: Natalia Davidson
Lecture is prepared by Prof. Sergey Kadochnikov, Natalia Davidson, Irina Aleynikova
Слайд 2
Описание слайда:
Activities and evaluation criteria
Activities within the course
Lectures – 36 hours (5% )
Exercise sessions (also discussion of papers) – 18 hours (20%)
Midterm exam (in class) – middle of October (15%)
Review of the paper (written; 5–7 minute presentation) - topics due 17 September (20%)
Final exam (40%)
Evaluation criteria
Excellent – 100-80% (from maximum of points received in class, or 70% from absolute maximum)
Good – 79-60%
Satisfactory – 59-40%
Fail – less than 40%
Слайд 3
Описание слайда:
References
Required
Markusen J.R., Melvin J.R., Kaempfer W.H., Maskus K.E. (1995) International Trade: Theory and Evidence. – New York: Harper & Row.
Krugman, P., Obstfeld, M. and M. Melitz (2011) International Economics: theory and policy (9th edition). Pearson.
Feenstra, R. and A. Taylor (2012) International Economics (2nd edition). Worth Publishers.
Recommended
Salvatore D. International Economics. Salvatore, D. (2010) International Economics: Trade and Finance 10th Edition.(and in Russian: М., 1998)
Varian H. Microeconomics: Intermediate. (and in Russian: М.: ЮНИТИ, 1997)
Пиндайк Р.С., Рубинфельд Д.Л. Микроэкономика. – М.: Дело, 2002.
Гальперин В.М., Игнатьев С.М., Моргунов В.И. Микроэкономика: В 2-х т./ Общая редакция В.М. Гальперина. - СПб.: Экономическая школа, 1997.
Кадочников С.М. Прямые зарубежные инвестиции: микроэкономический анализ эффектов благосостояния. – СПб.: Экономическая школа, 2002.
Слайд 4
Описание слайда:
Part I. General equilibrium in closed and open economies
Topic 1. Issues of International trade theory. Technical concepts of International Trade Theory and general equilibrium in closed economy.
Topic 2. General equilibrium of open economy
Topic 3. Gains from free international trade under perfect competition on the markets
Слайд 5
Описание слайда:
Topic 1. Issues of modern International Trade Theory. Technical concepts of International Trade Theory and general equilibrium in closed economy.
1.1. Structure, problems and specific features of International Trade Theory.
What is traded? Who is trading – countries or firms? In which sort of competition on global markets?
1.2. General equilibrium of production sector in closed economy. The concepts of technical and market efficiency in production.
1.3. Interrelation between technology and production possibility curve.
1.4. General equilibrium of household sector in closed economy. Concept of social indifference curves.
1.5. General equilibrium in closed economy.
Слайд 6
Описание слайда:
1.1. Russia and the other countries:
GDP per capita as a % of GDP per capita in USA (PPP – purchasing power parity)
Source: United Nations Statistical Division http://data.un.org
Слайд 7
Описание слайда:
1.1. Russia: main economic indicators
Source: International Trade Center, 2009
Слайд 8
Описание слайда:
1.1. Openness of an economy
What is openness of an economy?
Participation in international trade in goods and services
Participation in international migration of production factors
Absence of barriers to trade and factor migration
Towards all countries
Towards a group of countries
Convertibility of currency
Indicators of economic openness and of comparative advantages:
Coefficient of international trade dependence (international trade quota):
Кitd = (Exp+Imp) / GDP
Coefficient of export dependence (export quota):
Кеd = Exp / GDP
Index of revealed comparative advantages (method 1):
RCAIij (1) = (Expij/Expwj) / (Expi/Expw)
Index of revealed comparative advantages (method 2):
RCAIij (2) = 100[(Expij/Expi) - (Impij/ Impi)]
Слайд 9
Описание слайда:
Relation between openness and economic development
(for groups of countries)
Слайд 10
Описание слайда:
Principal exporters and importers of goods, 2006 (bln $US and %)
Слайд 11
Описание слайда:
Indicators of economic openness – example 1
International trade quota (Кitd)
Слайд 12
Описание слайда:
Gains from openness
i.e. arguments for economic openness
(1) Access to goods that are not produced in the country
(2) Increase in economic efficiency as a result of using comparative advantages by the country
(3) Increase in economic efficiency as a result of ‘copying’ (imitating) more advanced technologies and higher quality products
(4) Increase in economic efficiency as a result of stronger competition
Слайд 13
Описание слайда:
Indicators of comparative economic advantages - example 2
RCAIij (1) for USA, 2003-2007
Слайд 14
Описание слайда:
Indicators of comparative economic advantages - example 3
RCAIij (1) for Russia (2003-2007)
Слайд 15
Описание слайда:
Indicators of comparative economic advantages - example 4
RCAIij (2) for Russia (exported goods, 2003)
Слайд 16
Описание слайда:
Indicators of comparative economic advantages – example 5
RCAIij (2) for Russia (imported goods, 2003)
Слайд 17
Описание слайда:
Specific features of non-monetary international economics
Approach in the framework of comparative advantages:
Country A has a comparative advantage in good X, if in general equilibrium in closed economy the relative price of this good in country A is lower, than that of her trade partners (in the world economy).
Approach in the framework of relative prices:
How are relative prices defined?
Supply factors for at least 2 goods
Technological differences between countries (Smith, Ricardo)
Differences in resource endowments (Heckscher-Ohlin-Samuelson; Ricardo-Viner)
Intensity of competition
Demand factors for at least 2 goods
Different preferences among countries
Market structure for at least 2 goods
Example: prices under perfect competition are lower than under monopoly.
Approach in the framework of general economic equilibrium.
Approach in the framework of relative market segmentation.
Слайд 18
Описание слайда:
Слайд 19
Описание слайда:
Main macroeconomic indicators of the Russian economy
(% to the respective period of the previous year)
Слайд 20
Описание слайда:
Dynamics of Russian export (with seasonal correction,
1st quarter of 1994 – 1st quarter of 2010)
Слайд 21
Описание слайда:
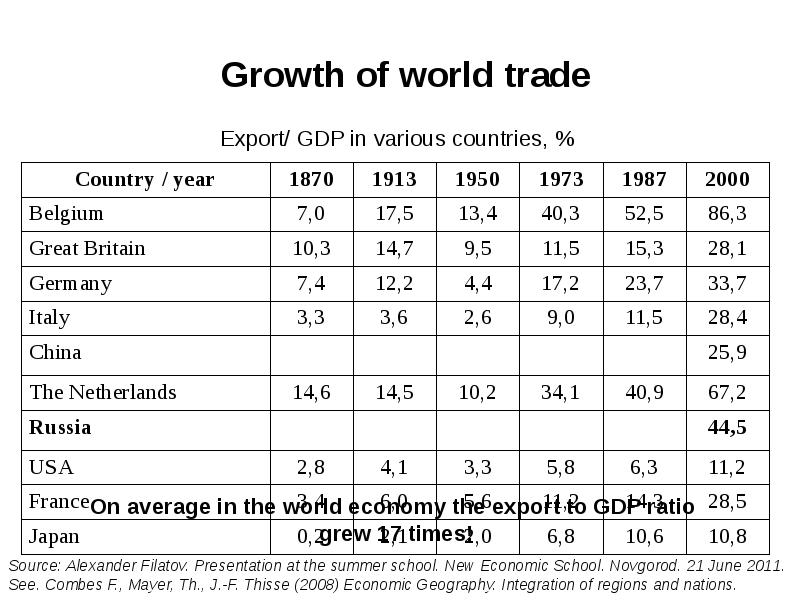
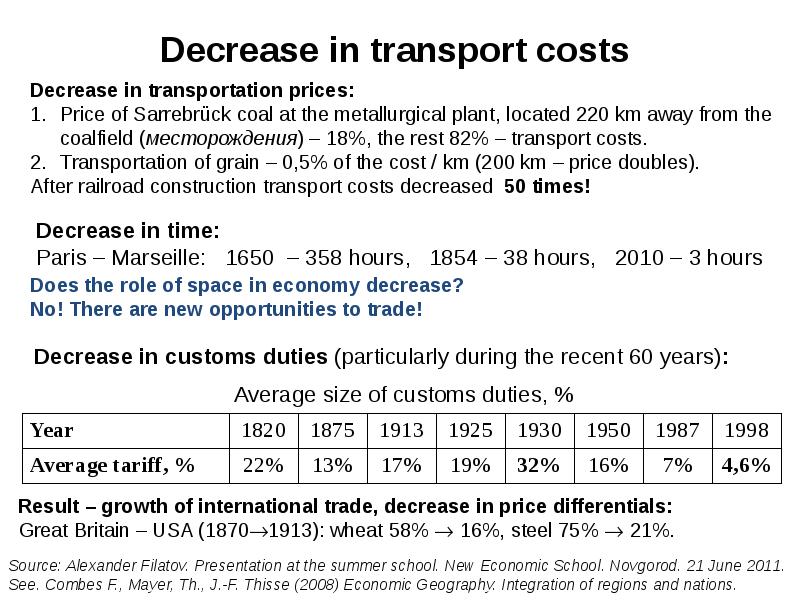
Why did the volumes of international trade grow?
Two waves of globalization connected to technological progress and trade liberalization - roughly 1870-1914 and 1960 to present (Baldwin, Martin (1999))
Growth of trade starting from 1950ies. GATT and significant decrease in tariffs in the industrialized countries
By 1980ies a number of developing countries inspired by success of South Korea and Taiwan liberalized their trade
Слайд 22
Описание слайда:
What kind of changes occur in international trade? Why?
Слайд 23
Описание слайда:
Слайд 24
Описание слайда:
Слайд 25
Описание слайда:
Changes in international trade. XX-XXI centuries
Growth in volumes of international trade
Development of intra-industry trade (see also an example on USA trade)
Growth of industrial goods share and decrease of agricultural products traded by developing countries
Increase in the range of traded goods; services are becoming tradable; outsoursing or offshoring
New theories of International Trade (1980ies):
Intra-industry trade
Imperfect competition
Increasing returns to scale
Decisions about trade are made by firms, not by countries
Based on Dixit-Stiglitz model of monopolistic competition (1977)
Слайд 26
Описание слайда:
Manufacturing intra-industry trade as a percentage of
total manufacturing trade
Слайд 27
Описание слайда:
Main issues of International Trade Theory and Policy
Which countries have trade relations?
Example: USA
Main trade partners of USA in Europe: Germany, France – countries with the highest GDP in Europe
Germany: 22.9% of European GDP and 23.4% of US trade with EU
Sweden: 2.9% of European GDP and 3.3% of US trade with EU
Canada and Mexico – the 1st and 3rd places in trade volumes with USA
Possible reasons ?
Source: Krugman, Obstfeld, 2008; US International Trade Commission, 2002
Слайд 28
Описание слайда:
Main issues of International Trade Theory and Policy
Newton’s gravity law: mass and distance
Gravity model of international trade:
Слайд 29
Описание слайда:
Слайд 30
Описание слайда:
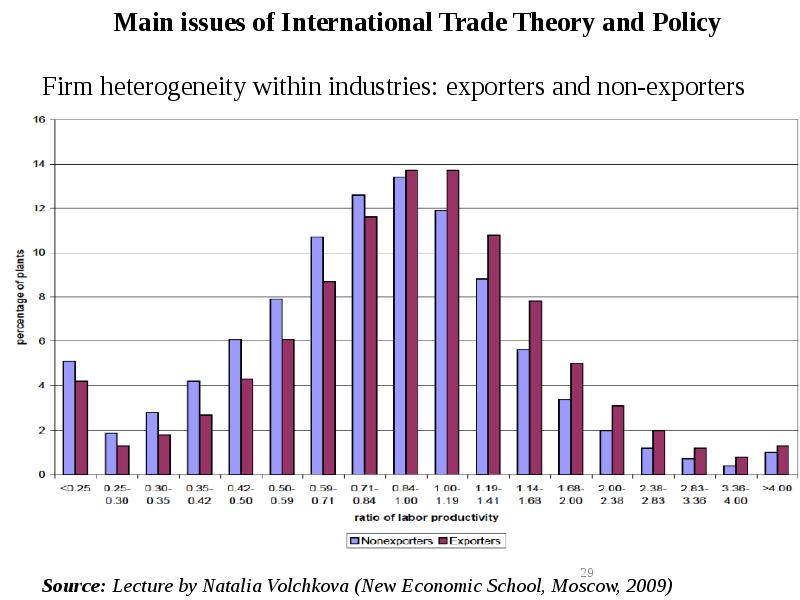
Models with heterogeneous firms*
Models with heterogeneous firms*
Scale of plants/firms heterogeneity inside industries: why is it important?
May an average firm belonging to an industry be analyzed?
Comparative advantage of a country: can it be changed?
--------------------------------------------------------------------------------
* This topic will be considered within the course of Advanced International Trade Theory
Слайд 31
Описание слайда:
Structure of International Trade Theory and Policy
(1) Theories of International Trade:
Classical theories of international trade;
Neoclassical theories of international trade;
Modern theories of international trade.
(2) Theories of International Trade Policy (normative and positive analysis):
Neoclassical theory of international trade policy;
Theory of strategic trade policy;
Political economy of protectionism.
(3) Theories of international movement of production factors:
Theory of international labour migration;
Theory of foreign portfolio investment;
Theory of foreign direct investment (FDI).
(4) Theory of international economic integration.
Слайд 32
Описание слайда:
Main issues of International Trade Theory and Policy. Trade
How is structure of international trade defined?
Structure of countries’ comparative advantages
Structure of export and import of the trading countries
Positive effects from international trade on the trading countries
The impact of trade on equilibrium volumes of production and consumption of goods
The impact of trade on equilibrium prices of final goods inside the countries and on the world market
The impact of trade on equilibrium prices of production factors (on the level and distribution of incomes of the owners of production factors)
Normative effects from international trade on the trading countries
The impact of trade on the welfare of trading countries
The impact of trade on the welfare of the world economy
Слайд 33
Описание слайда:
1.2. The model of general equilibrium in production sector
Exogenous parameters:
Production technology (minimum 2 goods) - production functions:
Х = fx (Kx, Lx);
Y = fy (Ky, Ly).
Resource endowment in the economy (minimum 2 resources) – capital (K) and labor (L):
K = Kx + Ky;
L = Lx + Ly.
Relative prices of final goods – Px/Py.
Market structure on the final goods markets – perfect competition.
Market structure on the production factor markets – perfect competition.
Endogenous parameters:
Equilibrium output and consumption of final goods: X*, Y*;
Equilibrium consumption of resources: Kx*, Ky*, Lx*, Ly*;
Equilibrium relative prices of resources: w*/r*.
Graphical illustration of endogenous parameters of the model.
Слайд 34
Описание слайда:
1.2. Characteristics of production function
General characteristics of production functions:
Substitution / complementarity between resources;
Returns from variable resource ;
Returns to scale in production :
Function Х = fx (Kx, Lx) is a homogeneous function of k degree for any λ (λ>0), if: λkХ = fx (λKx, λLx);
if k<1, a production function is characterized by decreasing returns to scale in production (DRS);
if k=1, a production function is characterized by constant returns to scale in production (CRS);
if k>1, a production function is characterized by increasing returns to scale in production (IRS).
For technologies with CRS – functional dependence on proportion in which resources are used in production;
Relative resource intensity:
If under any given MRTS the inequality Ky/Ly>Kx/Lx holds, the production technology of good Y is relatively capital intensive, and the production technology of good X is relatively labor intensive.
Слайд 35
Описание слайда:
1.2. Characteristics of production function - continued
Specific features of the production functions in the model:
Incomplete substitution / complementarity between resources;
Diminishing returns to a variable resource;
Constant returns to scale of production ;
Different resource intensity of technologies.
Слайд 36
Описание слайда:
1.2. Concept of Pareto-efficiency in production sector
Pareto-efficiency in production sector:
Named for the Italian economist Vilfredo Pareto
Allocation of resources and outputs among firms and owners is Pareto-efficient if it cannot be changed so that one firm or owner would reach a higher level of profit (revenue) while the level of profit (revenue) of the others would not decrease.
Technical efficiency:
Technically efficient combinations of outputs and resources – those combinations under which any reallocation of resources leads to diminishing of production level for at least one final good.
Graphical illustration.
Market (economic) efficiency:
Market efficient combinations of outputs and resources – those combinations under which the revenue of production sector is maximum possible given the available technologies and resources.
Graphical illustration.
Слайд 37
Описание слайда:
1.2. Algebraic solution of general equilibrium model in production sector
Algebraic solution (scheme):
PxMPlx(Kx,Lx)=w; PyMPly(Ky,Ly)=w; PxMPkx(Kx,Lx)=r; PyMPky(Ky,Ly)=r , то
=> Px/Py=MPly/MPlx (1)
=> Px/Py=MPky/MPkx (2)
According to exogenous parameters of the model the following conditions should hold:
K = Kx+ Ky (3)
L = Lx + Ly (4)
From four conditions (1), (2), (3), (4) four equilibrium parameters can be found: Kx*, Ky*, Lx*, Ly*
To find equilibrium production of final goods X*, Y* we plug equilibrium volumes of resources into production functions.
From the condition: MRTS=MPlх/MPkx=w/r equilibrium relative prices of resources can be found w*/r*.
Graphical illustration of the model solution.
See Graphical illustration of endogenous parameters.
Слайд 38
Описание слайда:
1.2. Graphical illustration of general equilibrium
in production sector
Graphical illustration of equilibrium on the final goods market (production possibilities curve):
If technologies with constant returns to scale are used in the economy, and there is perfect competition on the markets of final goods and production factors, then equilibrium production is reached at the point of production possibilities curve, where the final goods price line is tangent to production possibilities curve.
Graphical illustration of equilibrium on the production factors market (production contracts curve):
If technologies with constant returns to scale and incomplete substitution/complementarity between production resources are used in the economy, and there is perfect competition on the production factors markets, then in equilibrium production resources are allocated among industries in the point on the contract curve, where production factors price line is tangent to the isoquants of two industries.
Слайд 39
Описание слайда:
1.3. Interrelation between technology and
production possibility curve
Properties of technologies, affecting shape of production possibility curve:
Returns to scale of production;
Relative resource intensity (difference between technologies in terms of resource intensity).
Graphical illustration (production contract curve and production possibility curve):
Case 1: Absence of differences in resource intensity between technologies.
Case 2: Presence of differences in resource intensity between technologies.
Case 3: Technologies with high fixed costs.
Sufficient conditions for concavity of the production possibility curve:
Case 1: DRS
Case 2: CRS, difference in resource intensity between technologies
Слайд 40
Описание слайда:
Homework:
Homework:
Exercise session 1
Some references (please see details in the problem set for exercise session 1).
Markusen J.R., Melvin J.R., Kaempfer W.H., Maskus K.E. (1995) International Trade: Theory and Evidence. – New York: Harper & Row. – Ch. 2.
Krugman, P., Obstfeld, M. and M. Melitz (2011) International Economics: theory and policy (9th edition). Pearson. – Ch. 1, 2.
Feenstra, R. and A. Taylor (2012) International Economics (2nd edition). Worth Publishers. – Ch. 1.
(2) Think about topics for reports during exercise sessions and choose a paper for review (due 17 September 2016)
To do so:
Read newspapers and journals on current international economic issues.
Look through the papers suggested for review.
Look through the topics in syllabus and the textbooks/papers listed there.
Office hours: Friday 13:50 – 14:30, room 216.
E-mail: [email protected] (Наталья Борисовна Давидсон)
Скачать презентацию на тему International Trade : Theory and Policy можно ниже: