Logistic regression презентация
Содержание
- 2. Logistic Regression is a statistical method of classification of objects. In
- 3. A doctor classifies the tumor as malignant or benign. A
- 4. Logistic Regression is just one part of machine learning used for
- 5. There are other classification problems in which the output may be
- 10. We can take our linear regression solution and place it into
- 11. We can set a cutoff point at 0.5and we can say anything below 0.5 results
- 13. Convex cost function for logistic regression •If h goes to
- 14. Model evaluation After we have trained a logistic regression model on some training dataset
- 15. #example: testing the presence of a disease NO = negative test = False
- 16. Misclassification Rate: how often is it wrong? MR = (FP+FN)/total MR
- 18. Multi-class classification One-vs-all strategy: working with multiple binary classifications
- 20. How to deal with overfitting Seems having higher order of
- 21. Advantages: it doesn’t require high computational power is easily interpretable is used
- 22. Disadvantages: while working with Logistic regression you are not able to handle
- 23. https://www.youtube.com/watch?v=yIYKR4sgzI8
- 24. AT HOME https://www.youtube.com/watch?v=zAULhNrnuL4 https://www.youtube.com/watch?v=ckkiG-SDuV8 https://www.youtube.com/watch?v=NmjT1_nClzg https://www.youtube.com/watch?v=gcr3qy0SdGQ https://www.youtube.com/watch?v=gcr3qy0SdGQ https://www.youtube.com/watch?v=scVUuaLmb9o
- 25. Скачать презентацию


/total
MR")


Слайды и текст этой презентации
Слайд 1
Описание слайда:
Logistic regression
Слайд 2
Описание слайда:
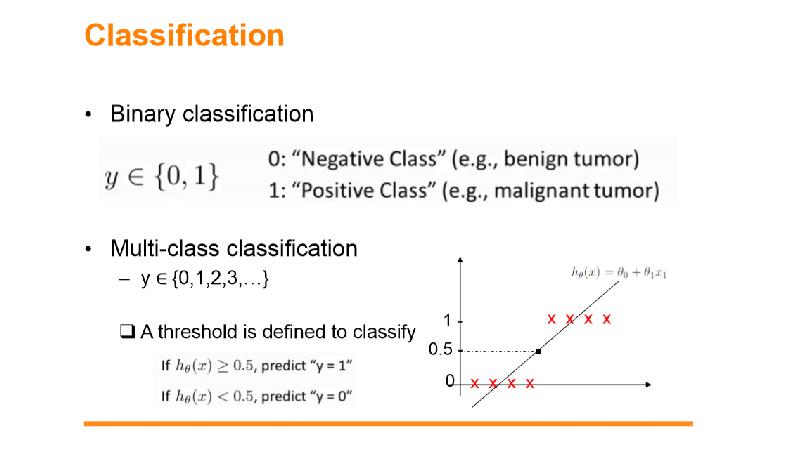
Logistic Regression is a statistical method of classification of objects.
In this tutorial, we will focus on solving binary classification problem using logistic regression technique.
This tutorial also presents a case study that will let youlearn how to code and apply Logistic RegressioninPython.
Слайд 3
Описание слайда:
A doctor classifies the tumor as malignant or benign.
A doctor classifies the tumor as malignant or benign.
A bank transaction may be fraudulent or genuine.
For many years, humans have been performing such tasks -albeit they are error-prone. The question is can we train machines to do these tasks for us with a better accuracy?
One such example of machine doing the classification is the email Clienton your machine that classifies every incoming mail as “spam” or “not spam” and it does it with a fairly large accuracy.
The statistical technique of logistic regression has been successfully applied in email client. In this case, we have trained our machine to solve a classification problem
Слайд 4
Описание слайда:
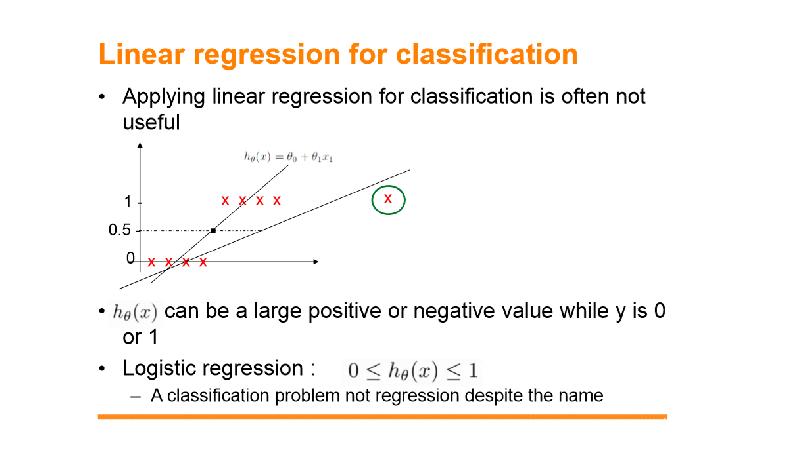
Logistic Regression is just one part of machine learning used for solving this kind of binary classification problem. There are several other machine learning techniques that are already developed and are in practice for solving other kinds of problems.
Logistic Regression is just one part of machine learning used for solving this kind of binary classification problem. There are several other machine learning techniques that are already developed and are in practice for solving other kinds of problems.
Here the outcome of the predication has only two values -Yes or No.
We call these as classes -so as to say we say that our classifier classifies the objects in two classes. In technical terms, we can say that the outcome or target variable is dichotomous in nature.
Слайд 5
Описание слайда:
There are other classification problems in which the output may be classified into more than two classes. For example, given abasket full of fruits, you are asked to separate fruits of different kinds. Now, the basket may contain Oranges, Apples, Mangoes, and so on. So when you separate out the fruits, you separate them out in more than two classes. This is a multivariate classification problem
Слайд 6
Описание слайда:
Слайд 7
Описание слайда:
Слайд 8
Описание слайда:
Слайд 9
Описание слайда:
Слайд 10
Описание слайда:
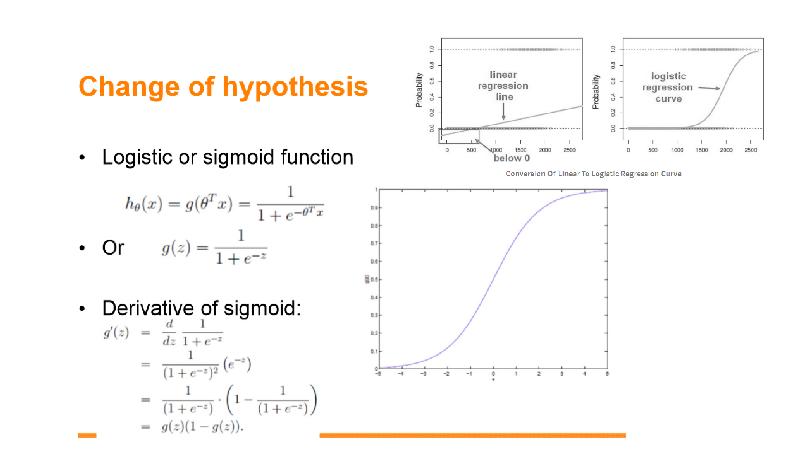
We can take our linear regression solution and place it into the sigmoid function and it looks something like this:
We can take our linear regression solution and place it into the sigmoid function and it looks something like this:
Слайд 11
Описание слайда:
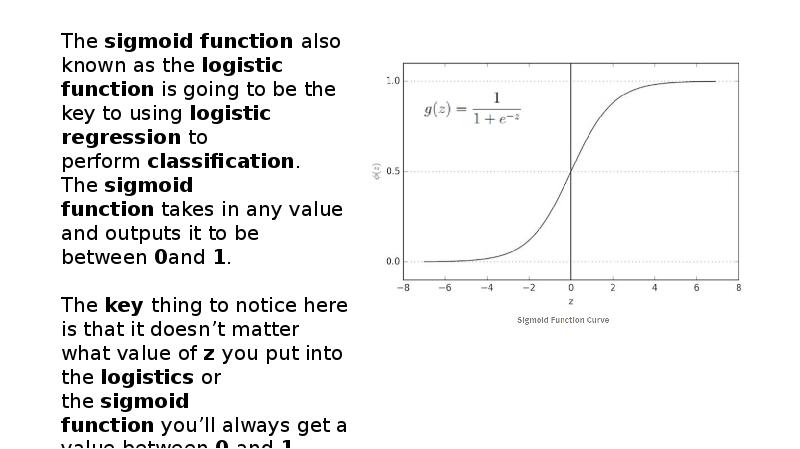
We can set a cutoff point at 0.5and we can say anything below 0.5 results in class 0 and anything above 0.5 belongs to class 1.
Слайд 12
Описание слайда:
Слайд 13
Описание слайда:
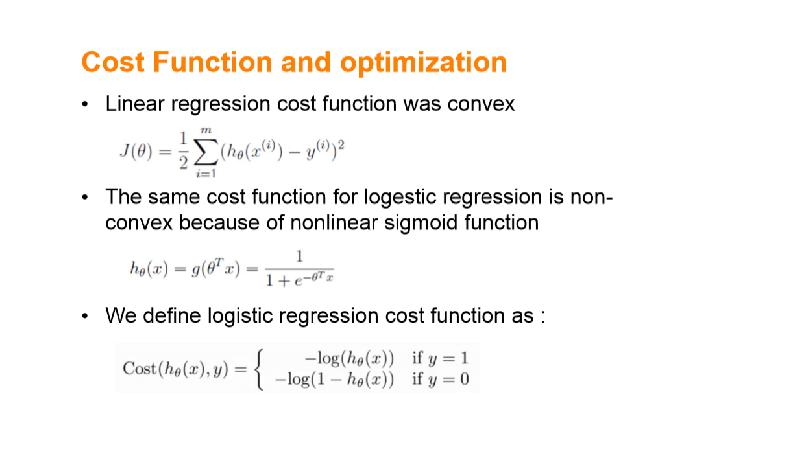
Convex cost function for logistic regression
•If h goes to zero and Cost also goes to zero, Class 0 is selected •If h goes to 1 and Cost goes to zero, class 1 is selected
Слайд 14
Описание слайда:
Model evaluation
After we have trained a logistic regression model on some training dataset we can evaluate the model’s performance on some test dataset, we can use confusion matrix to evaluate classification models.
Confusion matrix:
The confusion matrix is a table test is often used to describe the performance of the classification model on the test data for which the true values are already known, so we can use a confusion matrix to evaluate a model.
Слайд 15
Описание слайда:
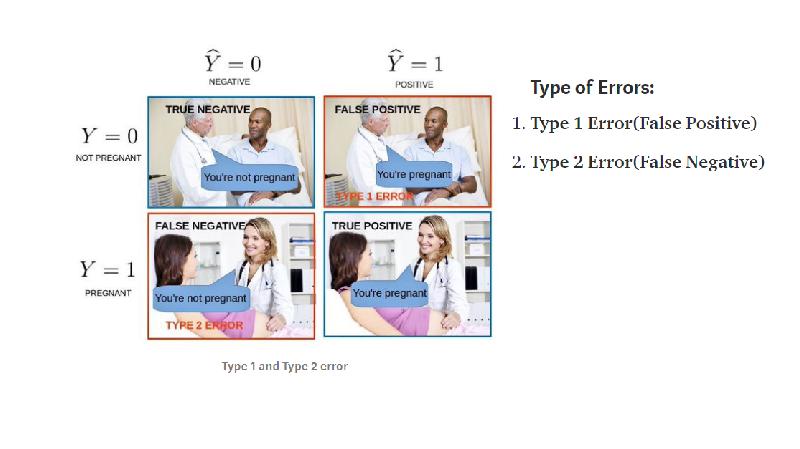
#example: testing the presence of a disease
NO = negative test = False = 0
YES = positive test = True = 1
Basic Terms:
True Positives(TP)= are the cases in which we predicted yes they have the disease and in reality, they do have the disease.
True Negative(TN)= are the cases in which we predicted no they don’t have the disease and in reality, they don’t have the disease.
False Positive(FP) = are the cases in which we predicted yes they have the disease and in reality, they don’t have the disease. This is also known as Type 1 Error.
False Negative(FN)= are the cases in which we predicted no they don’t have the disease and in reality, they do have the disease. This is also known as the Type 2 Error.
Слайд 16
Описание слайда:
Misclassification Rate:
how often is it wrong?
MR = (FP+FN)/total
MR = (10+5)/165 = 0.09
This is also called as the Error Rate
Слайд 17
Описание слайда:
Слайд 18
Описание слайда:
Multi-class classification
One-vs-all strategy: working with multiple binary classifications
We train one logistic regression classifier for each class i to predict the probability that y = i
Слайд 19
Описание слайда:
Слайд 20
Описание слайда:
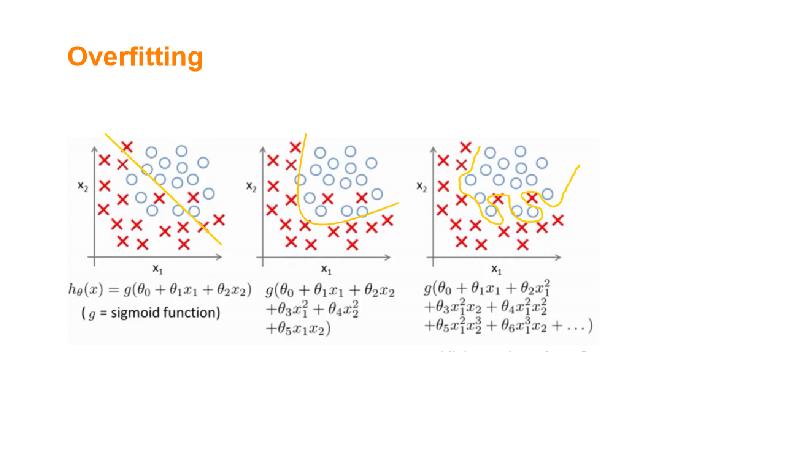
How to deal with overfitting
Seems having higher order of polynomials is good fit, but how to deal with overfitting?
Reduce the number of features manually –Keep all the features, but apply regularization
The most common variants in machine learning are L₁and L₂ regularization
–Minimizing E(X, Y) + α‖w‖, where w is the model's weight vector, ‖·‖ is either the L₁norm or the squared L₂norm, and α is a free parameter that needs to be tuned empirically
–Regularization using L₂norm is called Tikhonov regularization (Ridge regression), using L₁norm is called Lasso regularization
Слайд 21
Описание слайда:
Advantages:
it doesn’t require high computational power
is easily interpretable
is used widely by the data analyst and data scientists.
is very easy to implement
it doesn’t require scaling of features
it provides a probability score for observations.
Слайд 22
Описание слайда:
Disadvantages:
while working with Logistic regression you are not able to handle a large number of categorical features/variables.
it is vulnerable to overfitting
it cant solve the non-linear problem with the logistic regression model that is why it requires a transformation of non-linear features
Logistic regression will not perform well with independent(X) variables that are not correlated to the target(Y) variable.
Слайд 23
Описание слайда:
https://www.youtube.com/watch?v=yIYKR4sgzI8
Слайд 24
Описание слайда:
AT HOME
https://www.youtube.com/watch?v=zAULhNrnuL4
https://www.youtube.com/watch?v=ckkiG-SDuV8
https://www.youtube.com/watch?v=NmjT1_nClzg
https://www.youtube.com/watch?v=gcr3qy0SdGQ
https://www.youtube.com/watch?v=gcr3qy0SdGQ
https://www.youtube.com/watch?v=scVUuaLmb9o
Скачать презентацию на тему Logistic regression можно ниже: