Quantification of DNA презентация
Содержание
- 2. Two methods are widely used to determine the concentration of DNA
- 3. Nucleic acids The rings of the bases (A, C, G, T,
- 5. It operates on Beer’s law: It operates on Beer’s law:
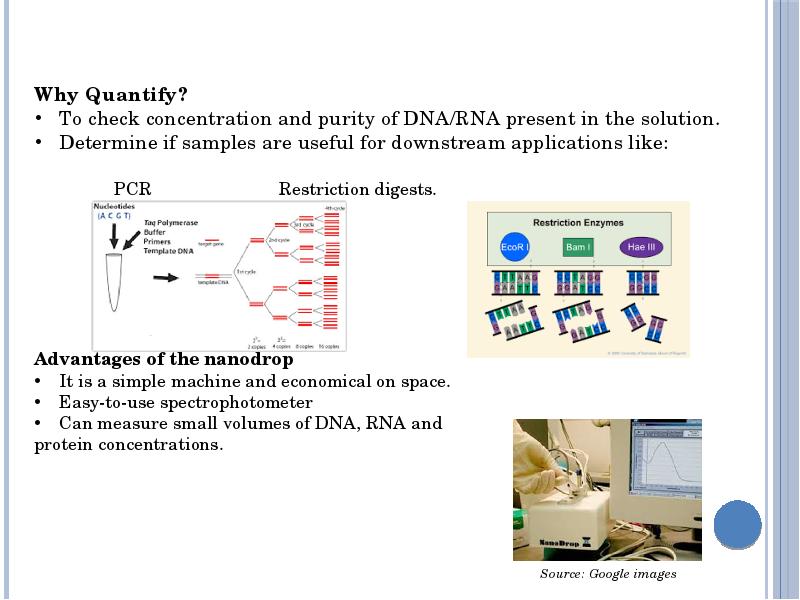
- 7. DNA Analysis (After extraction) DNA Analysis (After extraction)
- 19. Automated Sequencing Dye primer or dye terminator sequencing on capillary instruments.
- 21. Скачать презентацию


DNA Analysis (After extraction)")


Слайды и текст этой презентации
Слайд 1
Описание слайда:
Quantification of DNA
Слайд 2
Описание слайда:
Two methods are widely used to determine the concentration of DNA in solution. The most simple and accurate is the spectrophotometric method, but it has a relatively low sensitivity. If the total content of nucleic acids is small, the concentration of DNA can be determined from the intensity of their fluorescence in UV light after staining with ethidium bromide
Two methods are widely used to determine the concentration of DNA in solution. The most simple and accurate is the spectrophotometric method, but it has a relatively low sensitivity. If the total content of nucleic acids is small, the concentration of DNA can be determined from the intensity of their fluorescence in UV light after staining with ethidium bromide
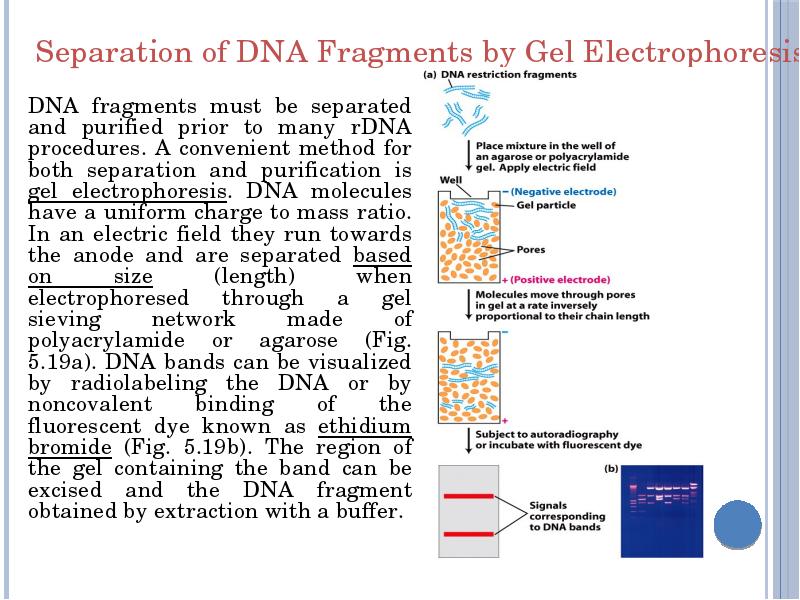
a. Electrophoretic Method For an approximate evaluation of the concentration of DNA, different amounts of marker nucleic acids are applied to the gel. The concentration of DNA in the sample is evaluated by comparing the fluorescence intensity of the sample and standard markers with known concentrations. It is important that the DNA samples are compared with the corresponding markers, since for the same amount of DNA the fluorescence intensity in UV light differs.
B. Spot Method The concentration of nucleic acids in a solution can be determined by staining the solution with ethidium bromide by measuring the fluorescence intensity in UV light and comparing it with the fluorescence of markers of known concentration. As with the electrophoretic method, the markers must be nucleic acids of the corresponding type (i.e., DNA)
Слайд 3
Описание слайда:
Nucleic acids
The rings of the bases (A, C, G, T, U)
are made up of alternating single
and double bonds.
Such ring structures absorb in
the U.V.
Each of the four nucleotide
bases has a slightly different
absorption spectrum, and the
spectrum of DNA is the average
of them.
Слайд 4
Описание слайда:
Слайд 5
Описание слайда:
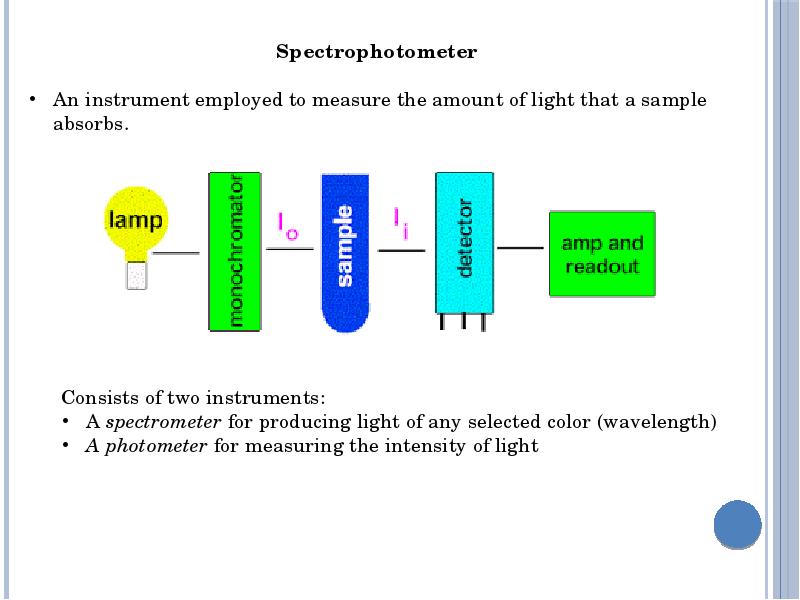
It operates on Beer’s law:
It operates on Beer’s law:
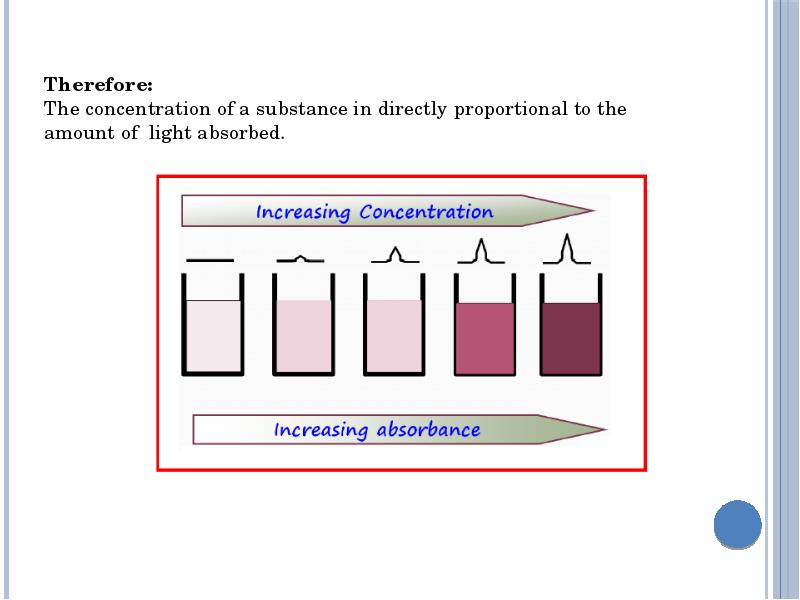
When monochromatic light (light of a specific wavelength) passes through a solution there is usually a quantitative relationship (Beer's law) between the solute concentration and the intensity of the transmitted light, that is, the more concentrated the specimen is, the less light is transmitted through it.
Слайд 6
Описание слайда:
Слайд 7
Описание слайда:
DNA Analysis (After extraction)
DNA Analysis (After extraction)
Nucleic acid (DNA/RNA)
Qualitative analysis Quantitative analysis
Size-Quality Purity- Yield
Agarose gel electrophoresis Spectrophotometry
Слайд 8
Описание слайда:
Слайд 9
Описание слайда:
Слайд 10
Описание слайда:
Слайд 11
Описание слайда:
Слайд 12
Описание слайда:
Слайд 13
Описание слайда:
Слайд 14
Описание слайда:
Слайд 15
Описание слайда:
Слайд 16
Описание слайда:
Слайд 17
Описание слайда:
Слайд 18
Описание слайда:
Слайд 19
Описание слайда:
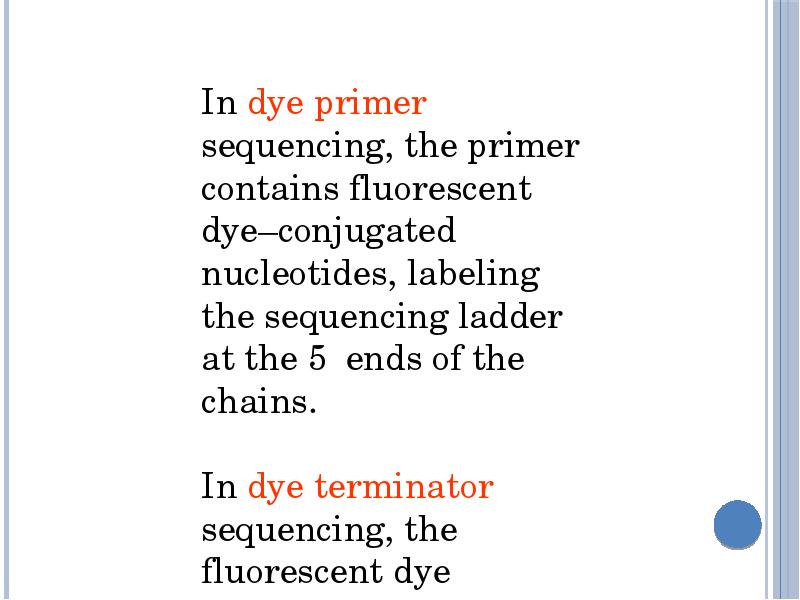
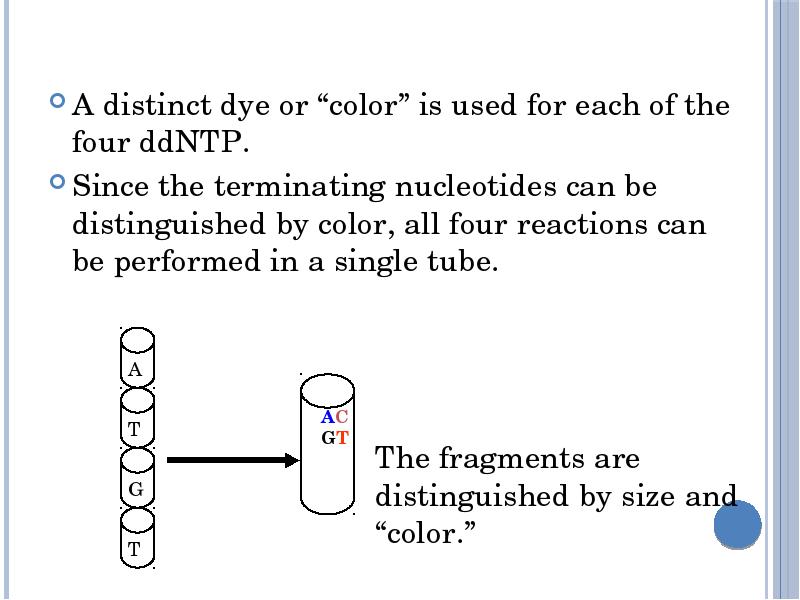
Automated Sequencing
Dye primer or dye terminator sequencing on capillary instruments.
Sequence analysis software provides analyzed sequence in text and electropherogram form.
Peak patterns reflect mutations or sequence changes.
Слайд 20
Описание слайда:
Скачать презентацию на тему Quantification of DNA можно ниже: