Retirement Saving & Spending Study презентация

Содержание


Презентации» Экономика» Retirement Saving & Spending Study
Millennial, Gen X, and Baby Boomer Workers and Retirees  
Table of Contents 
 Methodology 
 Workers with 401(k)s: Millennials, GenMethodology
 3,026 working adults 18+ currently contributing to a 401(k) planWorkers’ 401(k) AccountsMarket Value of 401(k) PlanBase: Millennial workers
 Base: Millennial workersPersonal Deferral Rate401(k) Contribution Compared With Past 12 Months
 Retirement Saving and SpendingRecommended Contribution
 Retirement Saving and Spending Study RSS2 © 2015 BrightworkIncreasing Your 401(k) Contribution
 Retirement Saving and Spending Study RSS2 ©Reasons for Contributing Below the Maximum
 Retirement Saving and Spending StudyMajor Reasons for Contributing Below the Maximum
 Retirement Saving and SpendingInfluence of Match on Contribution
 Retirement Saving and Spending Study RSS2Retirement Expectations
 Retirement Saving and Spending Study RSS2 © 2015 BrightworkBase: Workers
 Base: WorkersAuto-Features and  Target Date FUNDSTrue of Target Date Funds
 Retirement Saving and Spending Study RSS2True of Target Date Funds (cont.)
 Retirement Saving and Spending StudyMarket Value and Allocation of Assets
 Retirement Saving and Spending StudySatisfaction with Investments Overall
 Retirement Saving and Spending Study RSS2 ©Automatic Enrollment Summary
 Retirement Saving and Spending Study RSS2 © 2015Opt Out Rate
 Retirement Saving and Spending Study RSS2 © 2015Base: Total workers who were enrolled automatically with the choice toAttitudes About Automatic Enrollment
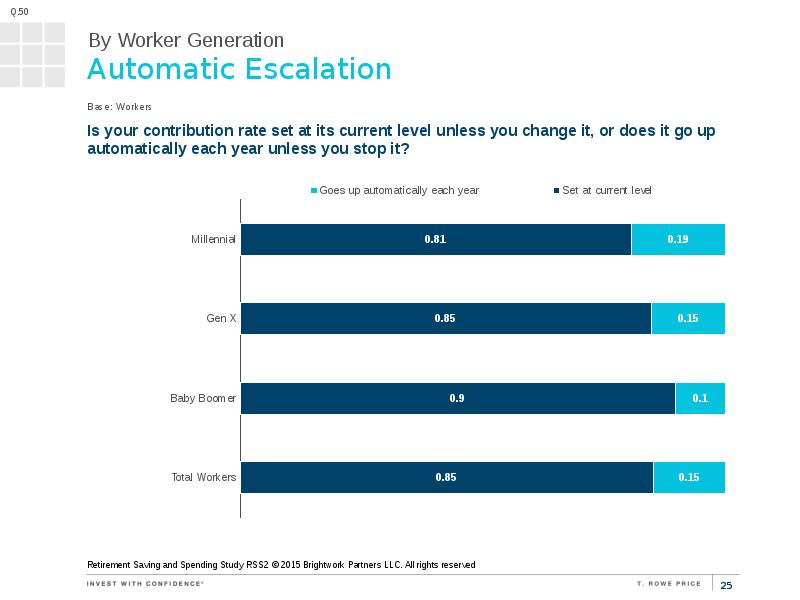
 Retirement Saving and Spending Study RSS2 ©Automatic Escalation
 Retirement Saving and Spending Study RSS2 © 2015 BrightworkSpending, saving, and adviceDealing With Money
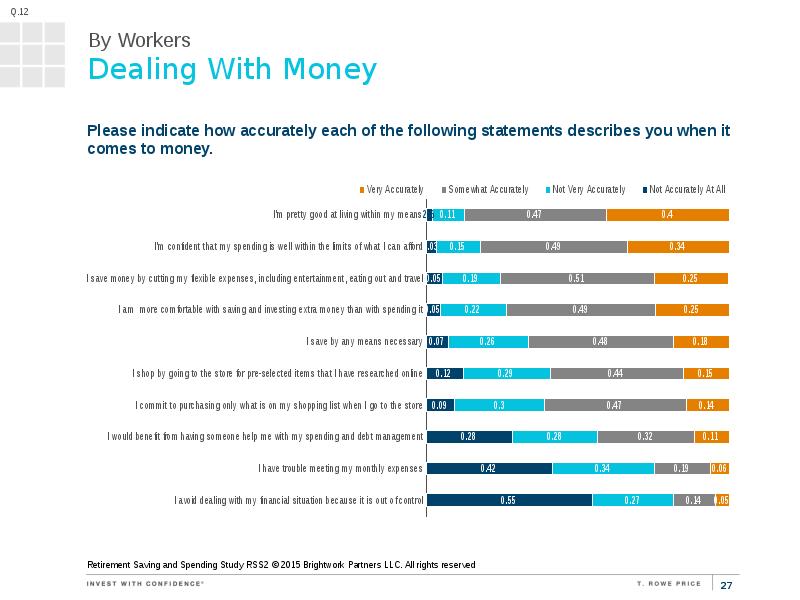
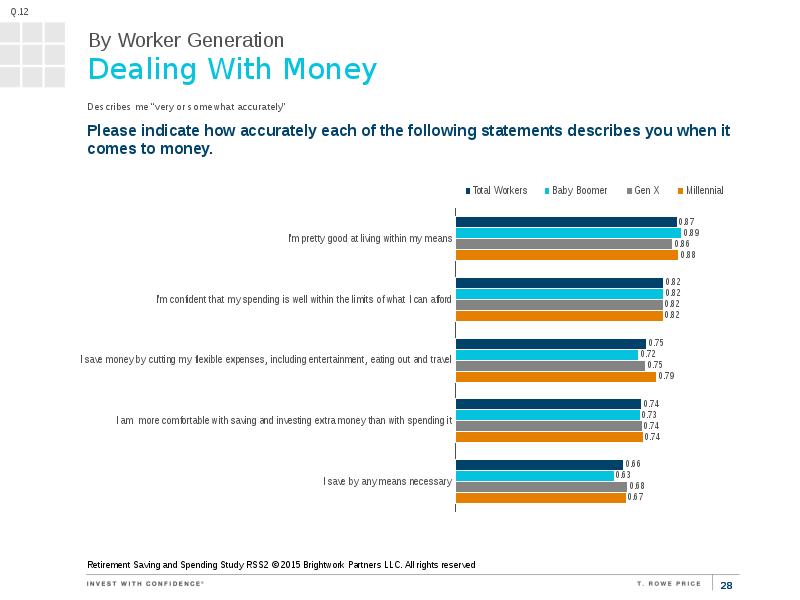
 Retirement Saving and Spending Study RSS2 © 2015Dealing With Money
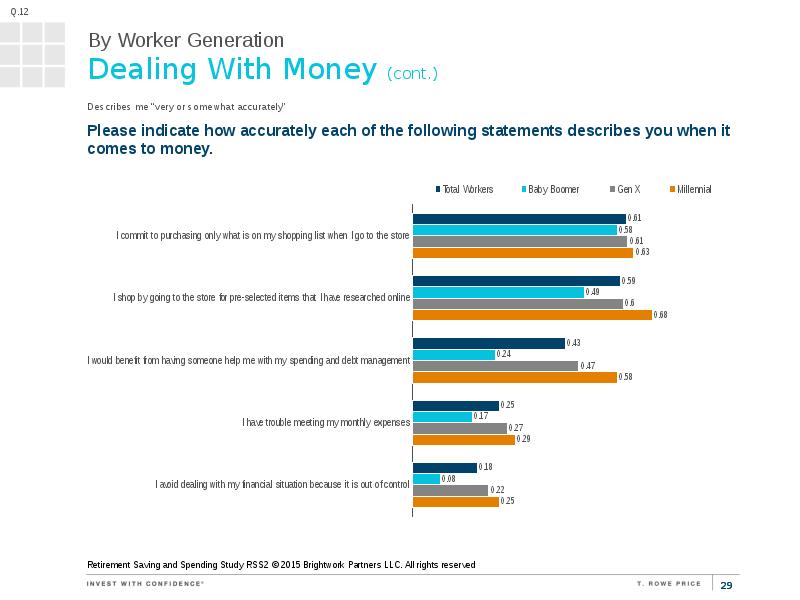
 Retirement Saving and Spending Study RSS2 © 2015Dealing With Money (cont.)
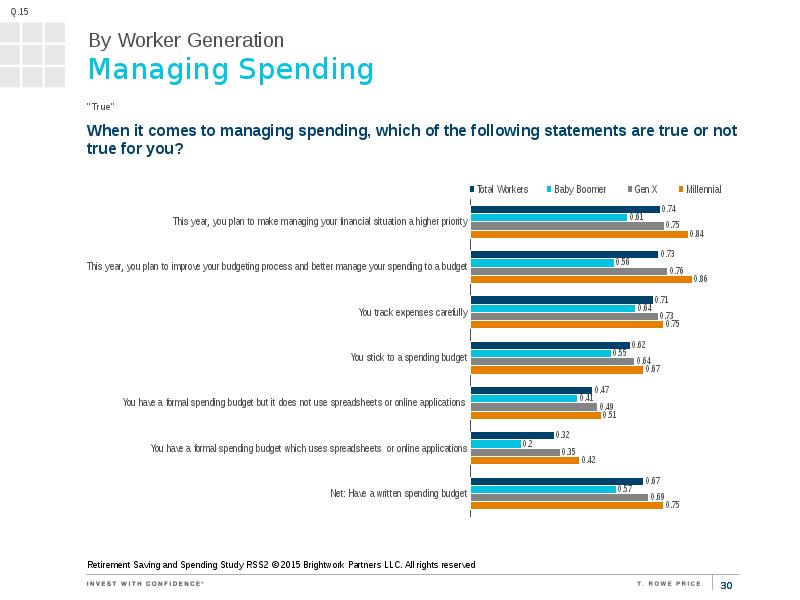
 Retirement Saving and Spending Study RSS2 ©Managing Spending
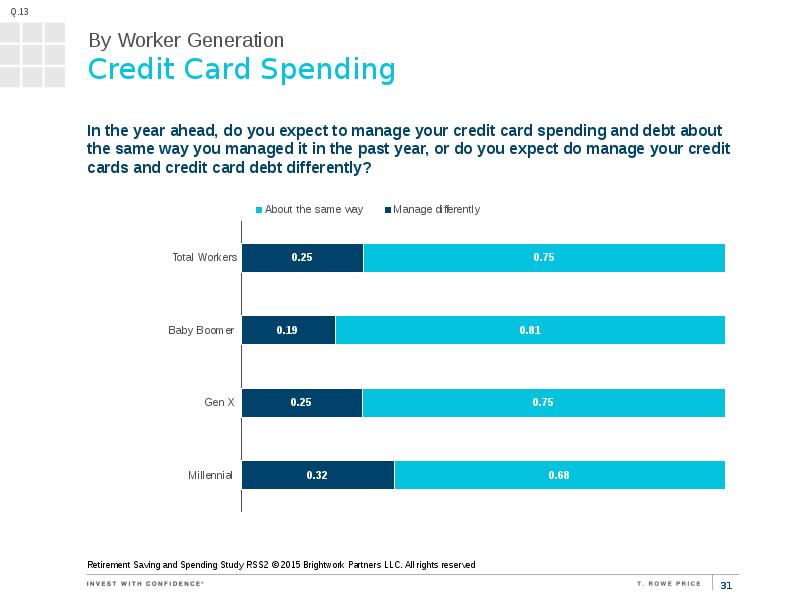
 Retirement Saving and Spending Study RSS2 © 2015 BrightworkCredit Card Spending
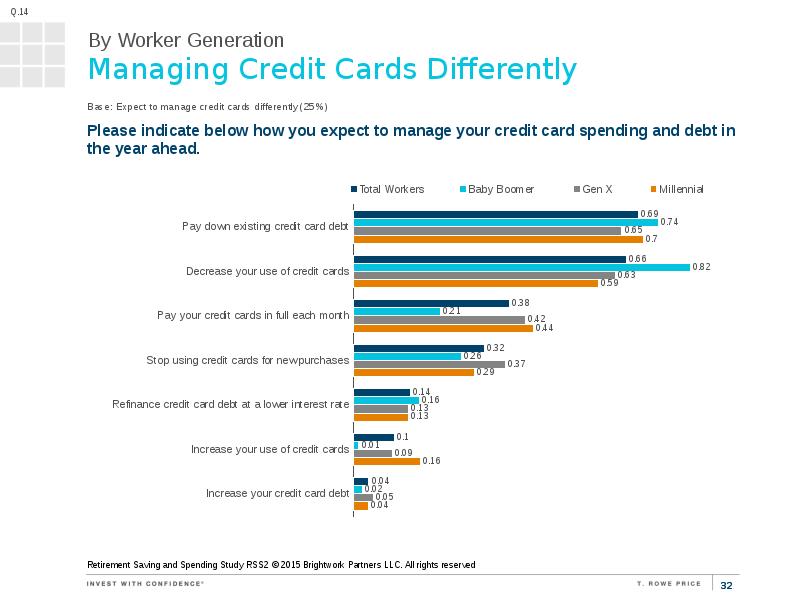
 Retirement Saving and Spending Study RSS2 © 2015Managing Credit Cards Differently
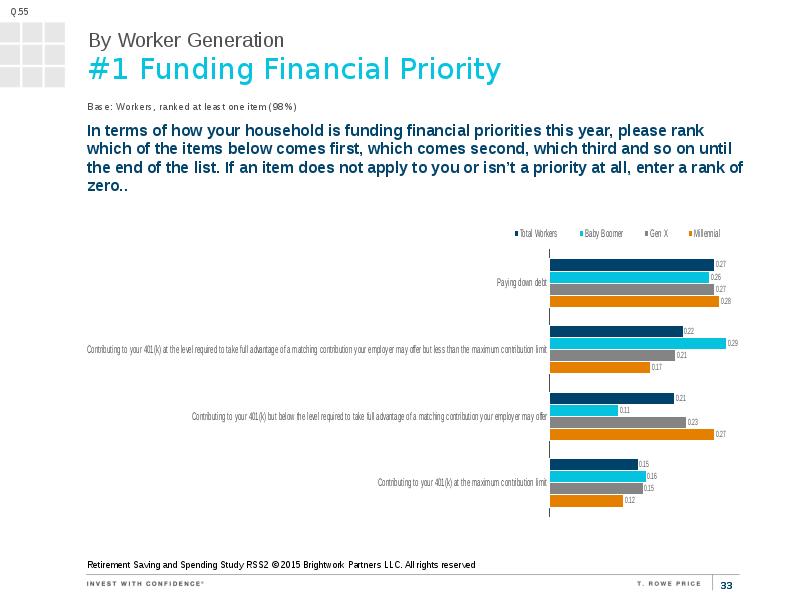
 Retirement Saving and Spending Study RSS2 ©#1 Funding Financial Priority
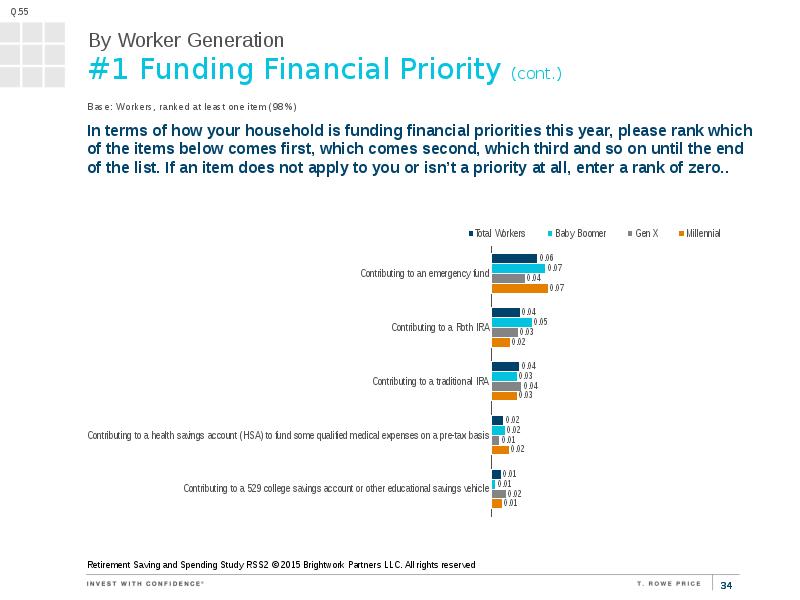
 Retirement Saving and Spending Study RSS2 ©#1 Funding Financial Priority (cont.)
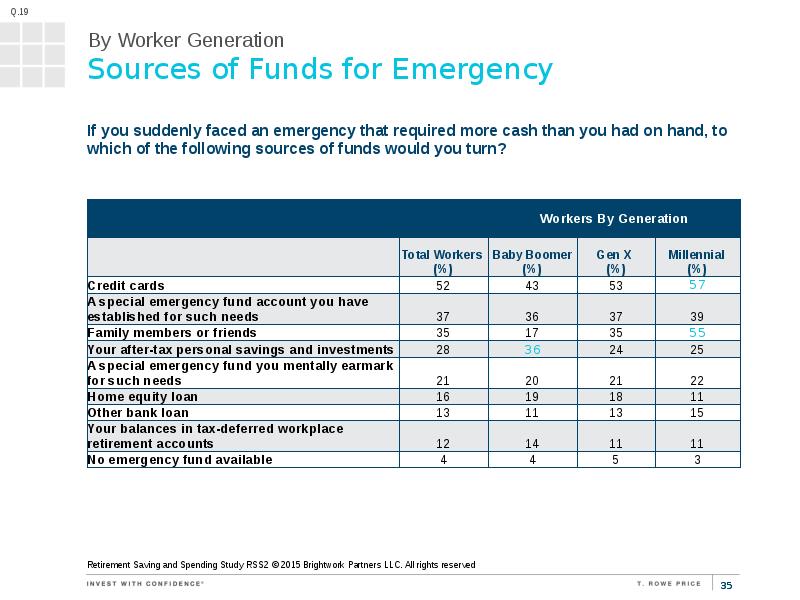
 Retirement Saving and Spending Study RSS2Sources of Funds for Emergency
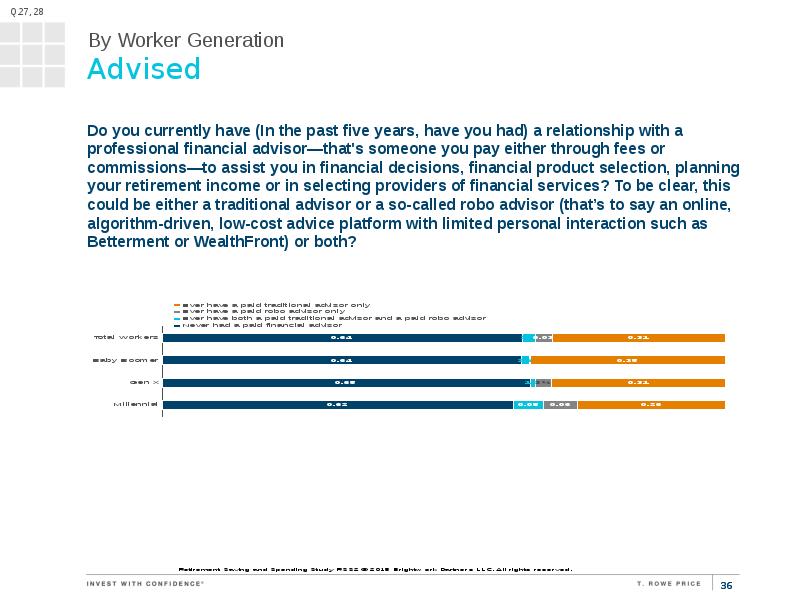
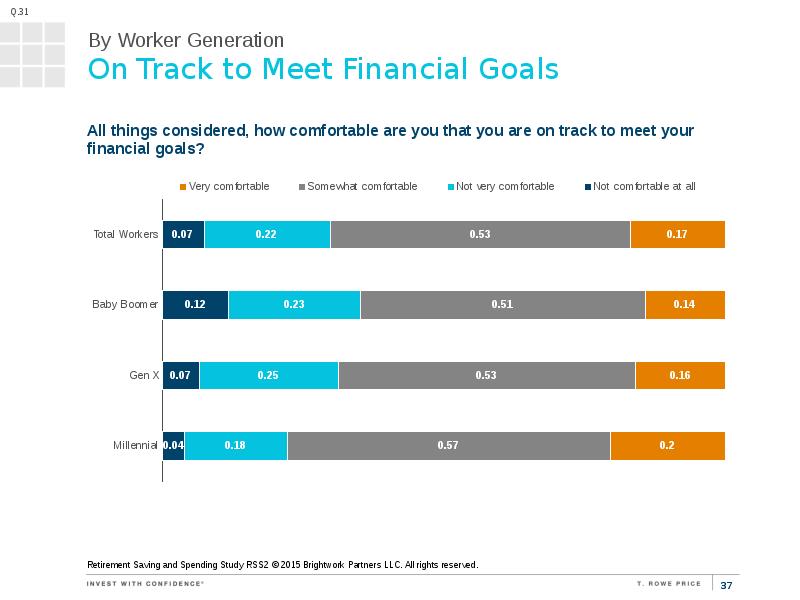
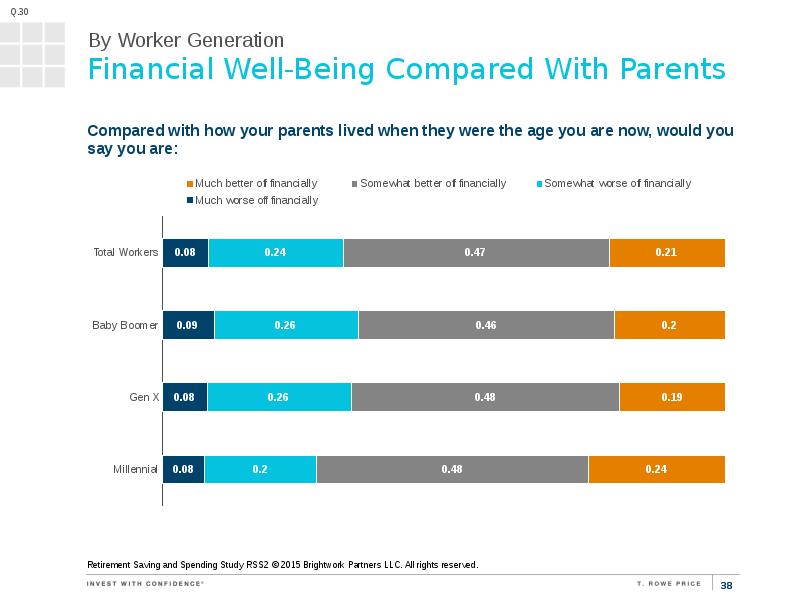
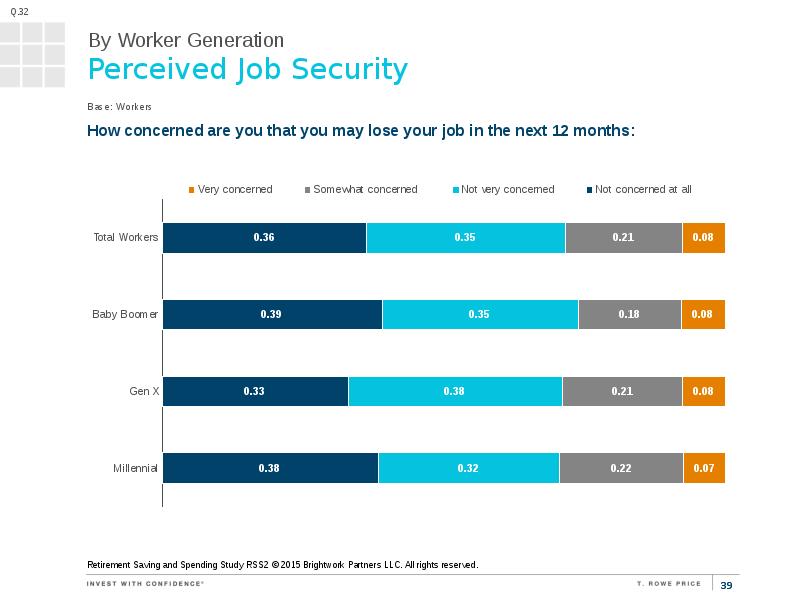
 Retirement Saving and Spending Study RSS2AdvisedOn Track to Meet Financial GoalsFinancial Well-Being Compared With ParentsPerceived Job Security
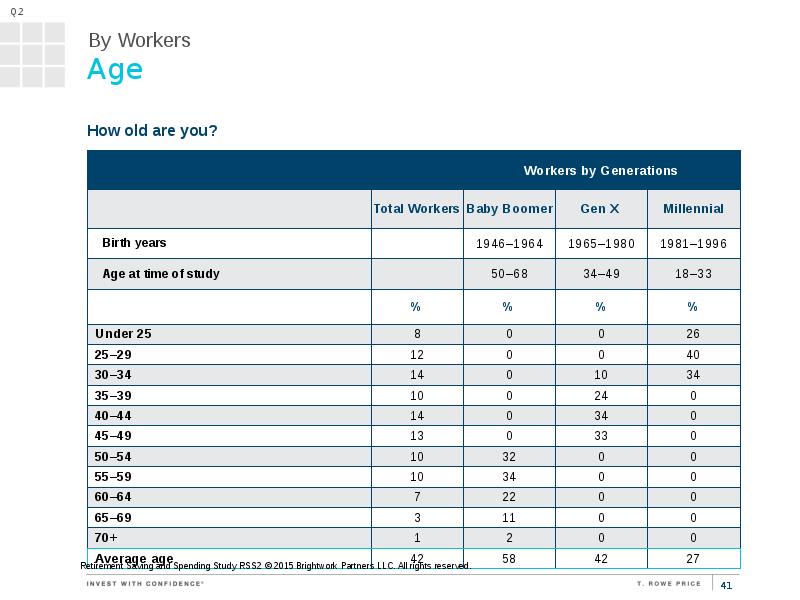
 Base: WorkersProfiles of workers with 401(k)s: Millennials, Gen X, and Baby BoomersAge
 Q. 2Size of Organization
 Retirement Saving and Spending Study RSS2 © 2015Work Status
 Base: WorkersLevel of Qualification for Position
 Base: WorkersTenure at Current Employer
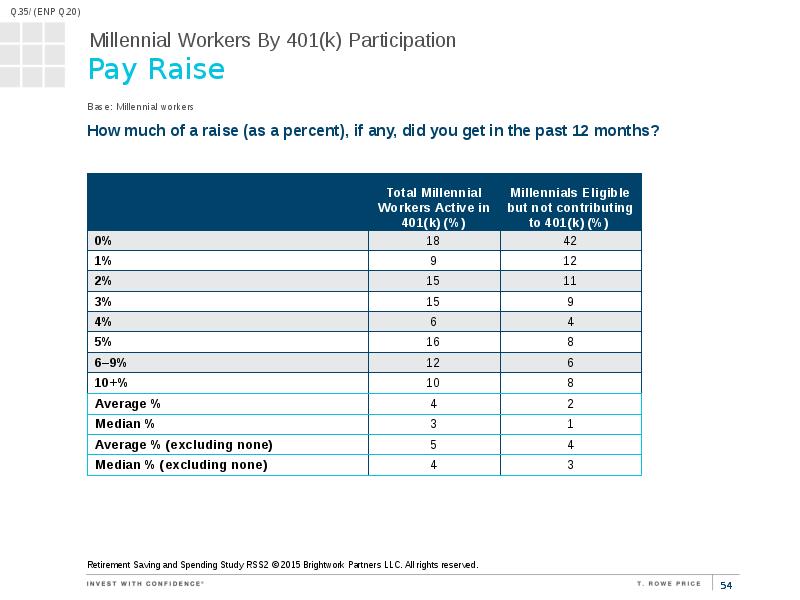
 Base: Millennial workersPay Raise
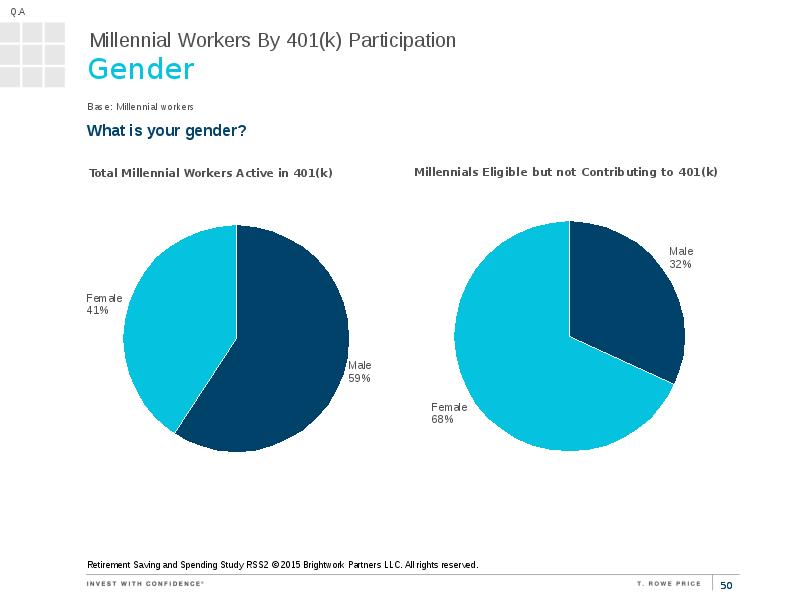
 Base: WorkersPersonal and Household Income and Total DebtMillennials who are eligible to participate in their employers’ 401(k) butAgeGender
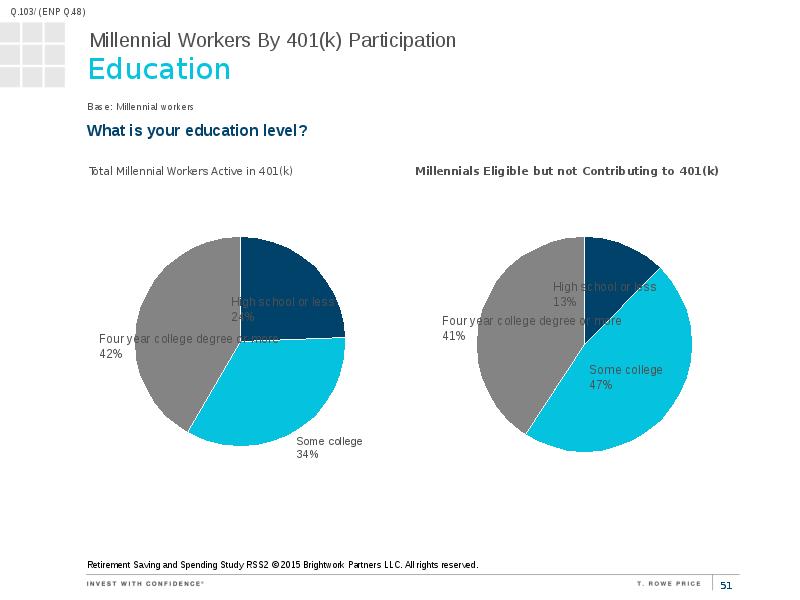
 Base: Millennial workersEducation
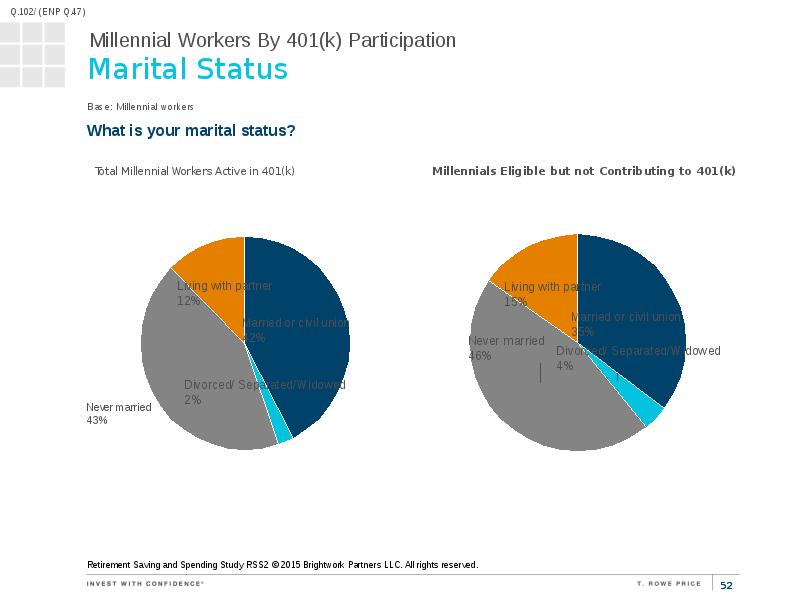
 Base: Millennial workersMarital Status
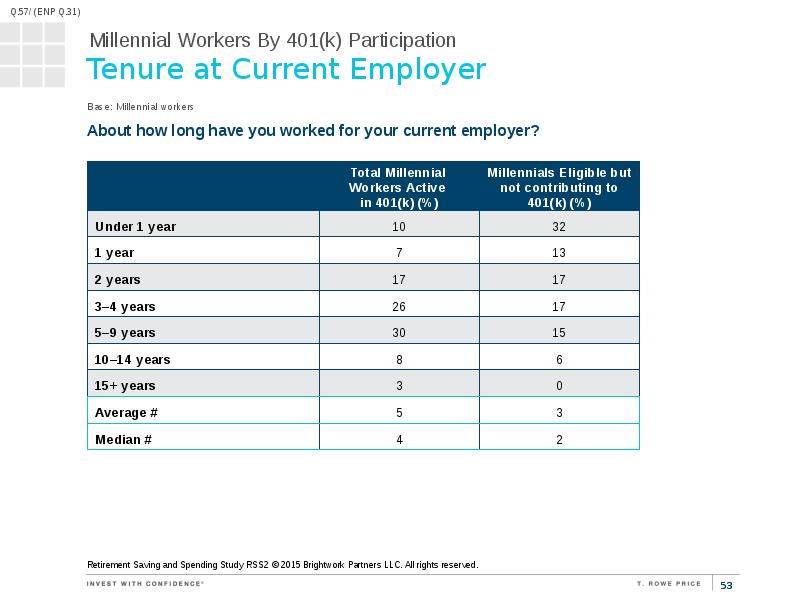
 Base: Millennial workersTenure at Current Employer
 Base: Millennial workersPay Raise
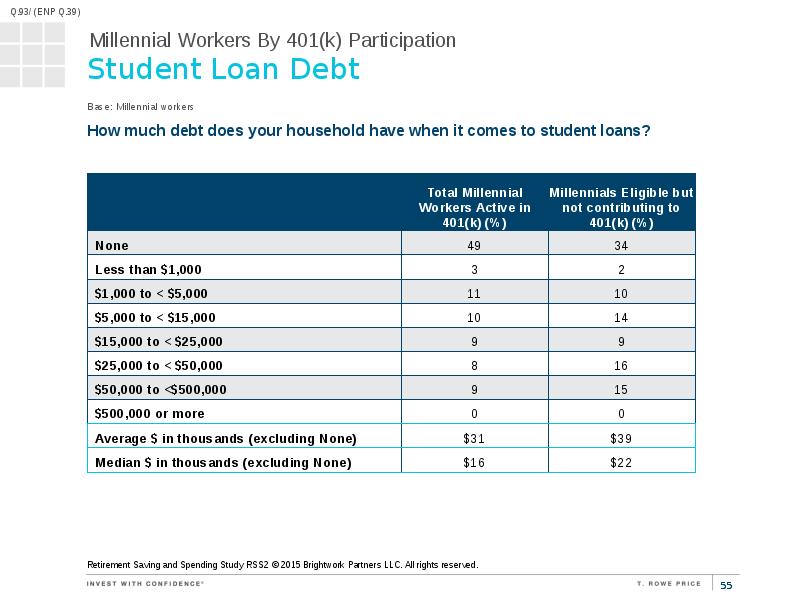
 Base: Millennial workersStudent Loan Debt
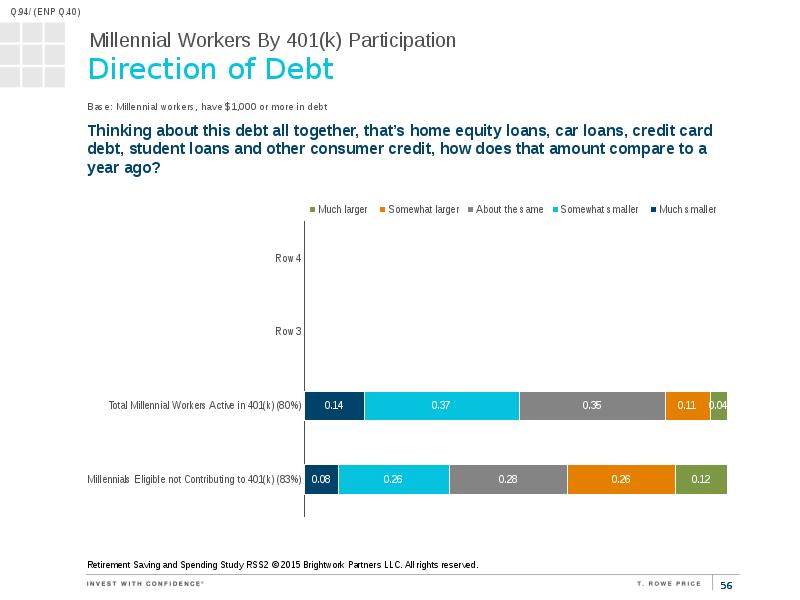
 Base: Millennial workersDirection of Debt
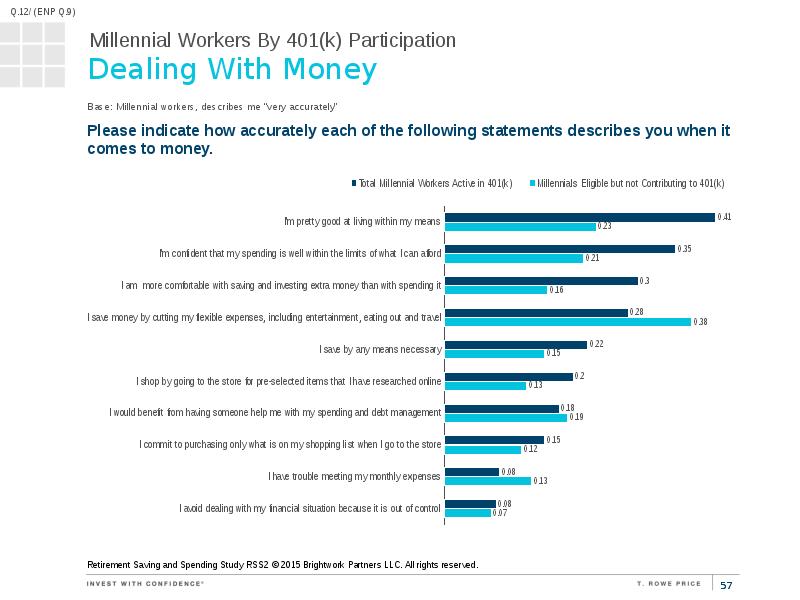
 Base: Millennial workers, have $1,000 or more inDealing With Money
 Base: Millennial workers, describes me “very accurately"Major Reasons for Contributing Below the Maximum
 Base: Millennial workers, notFinancial Well-Being Compared With Parents
 Base: Millennial workersRetirees who saved  in 401(k)sAge
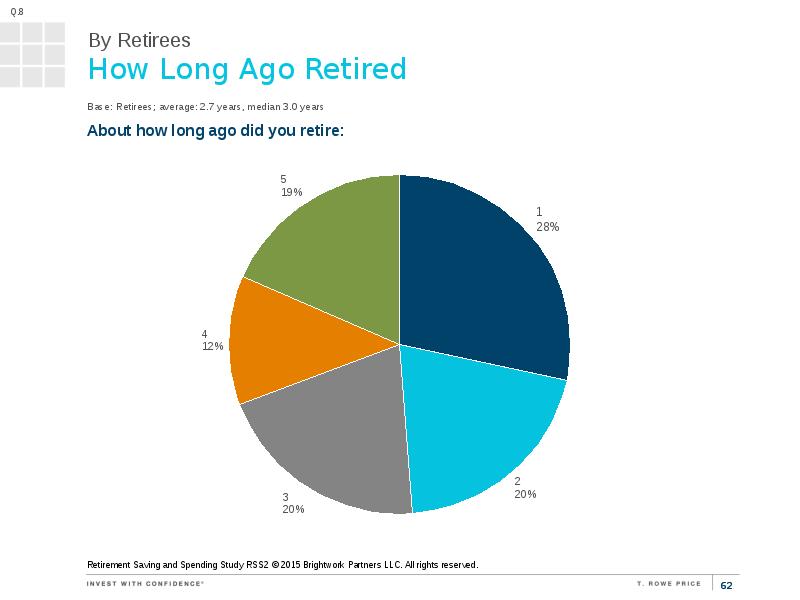
 Average Age 63How Long Ago Retired
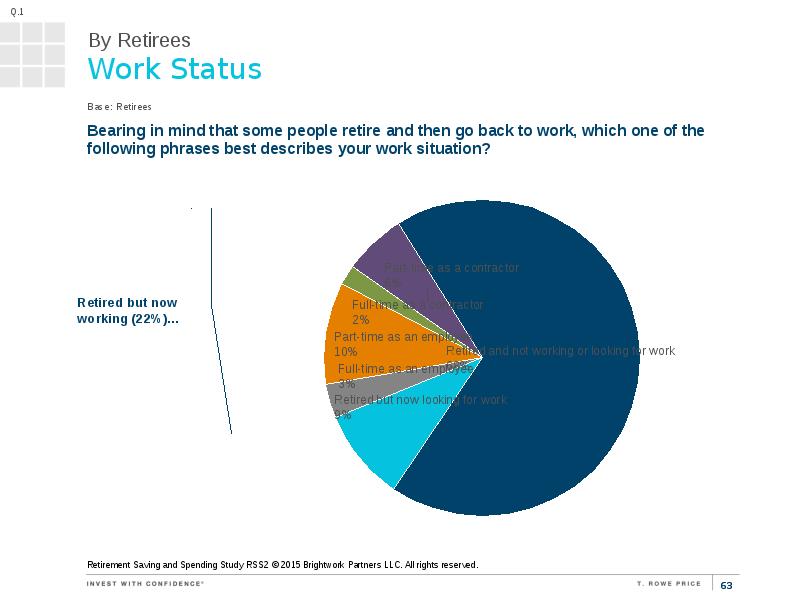
 Base: Retirees; average: 2.7 years, median 3.0Work Status
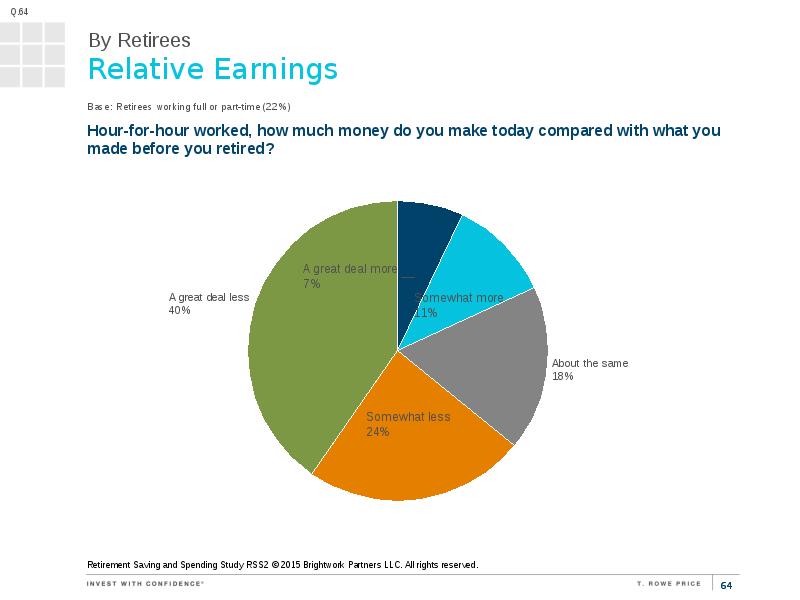
 Base: RetireesRelative Earnings
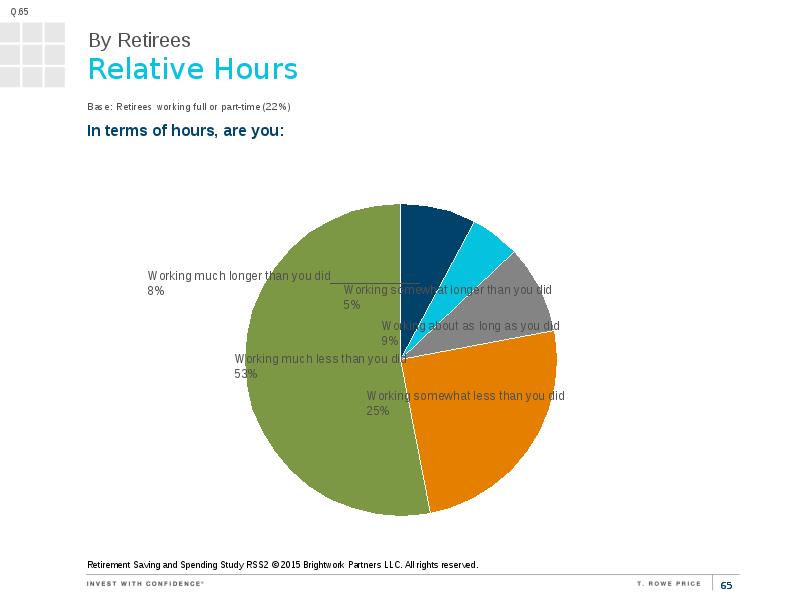
 Base: Retirees working full or part-time (22%)Relative Hours
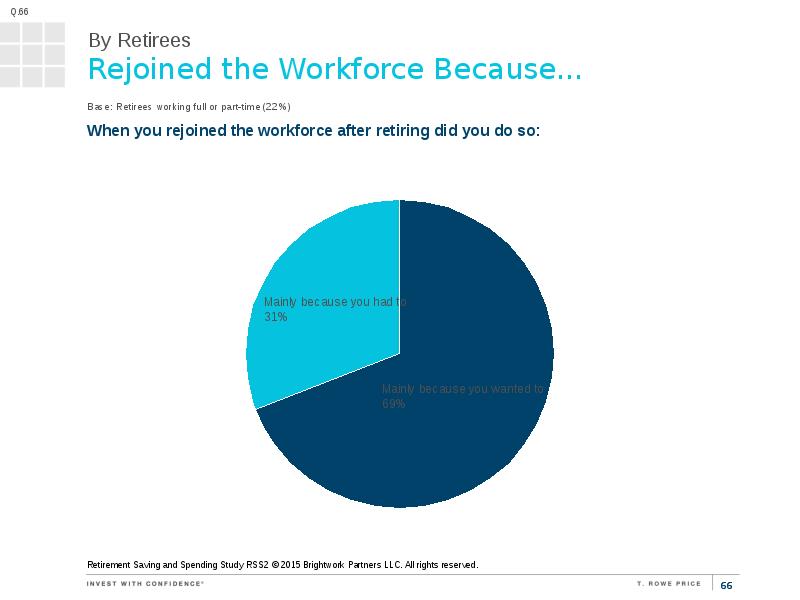
 Base: Retirees working full or part-time (22%)Rejoined the Workforce Because...
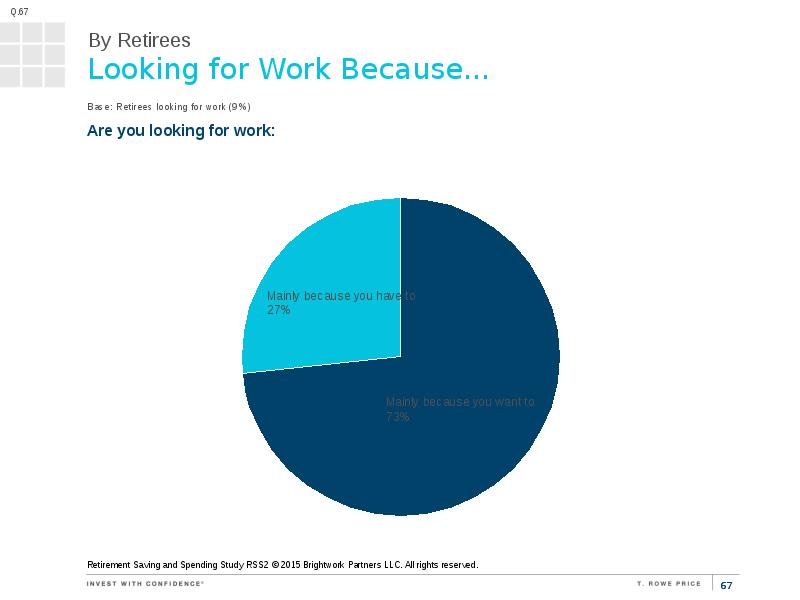
 Base: Retirees working full or part-time (22%)Looking for Work Because...
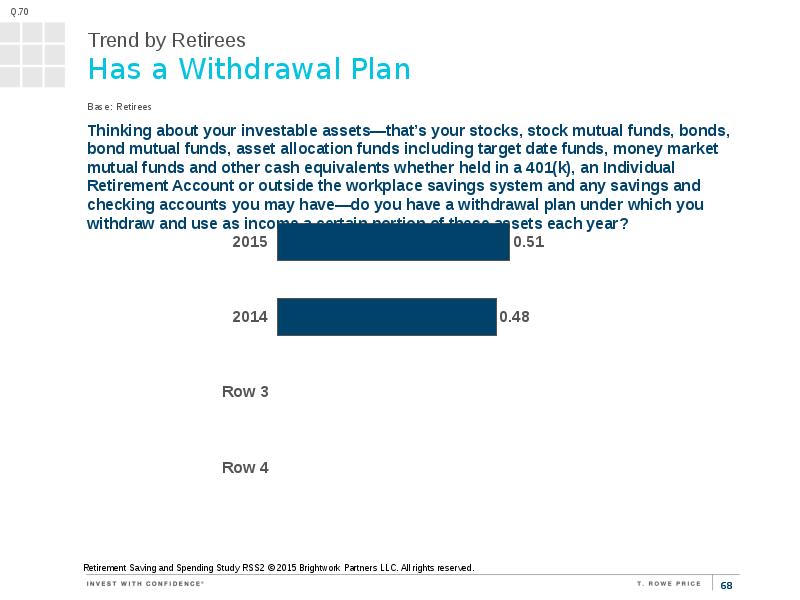
 Base: Retirees looking for work (9%)Has a Withdrawal Plan
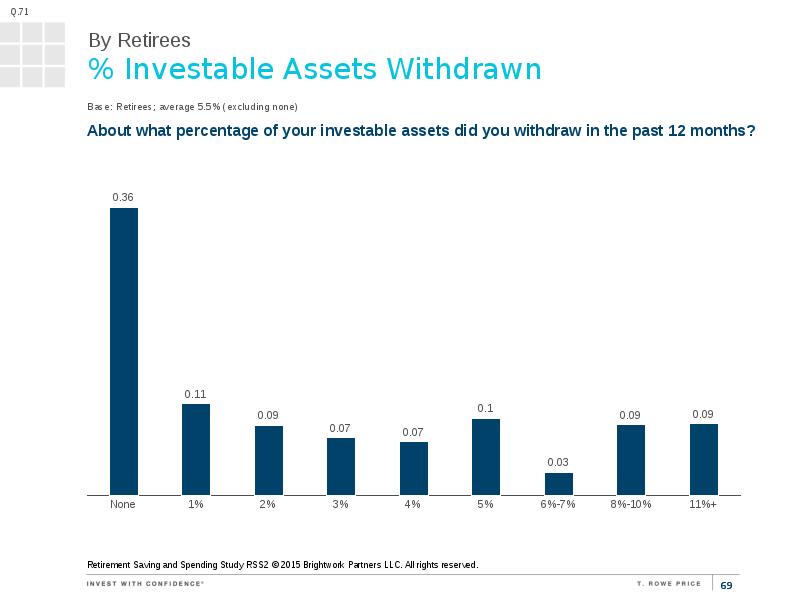
 Base: Retirees% Investable Assets Withdrawn
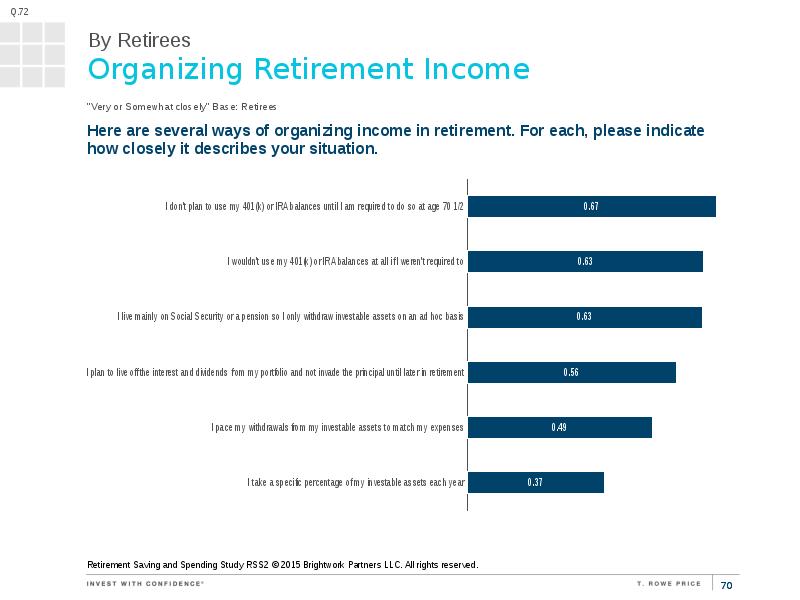
 Base: Retirees; average 5.5% (excluding none)Organizing Retirement Income
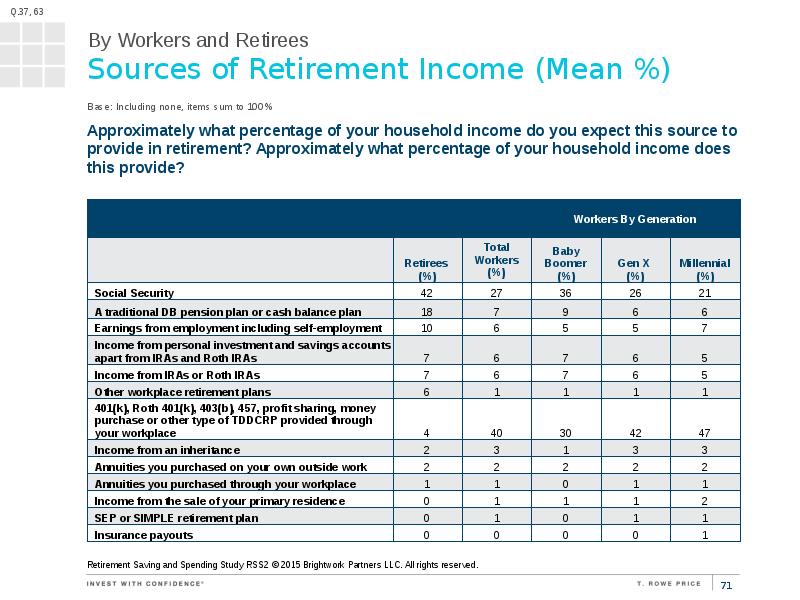
 "Very or Somewhat closely" Base: RetireesSources of Retirement Income (Mean %)
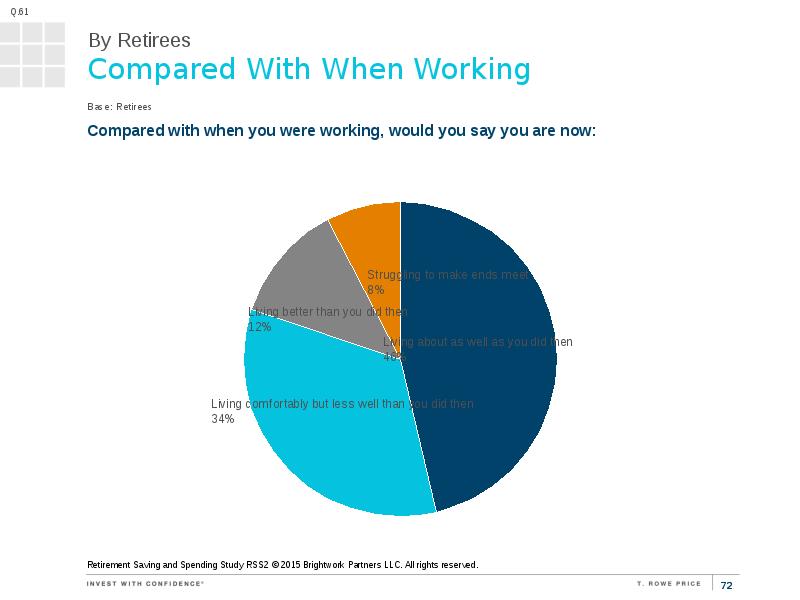
 Base: Including none, items sumCompared With When Working
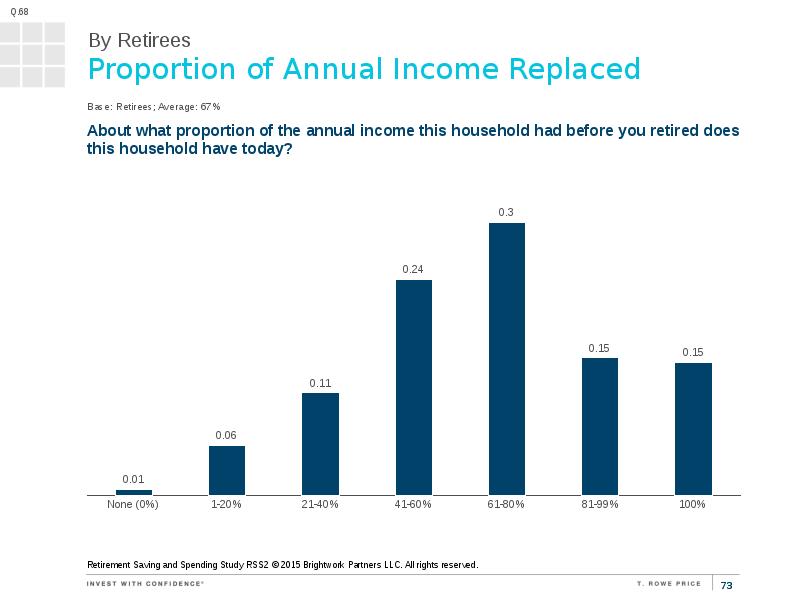
 Base: RetireesProportion of Annual Income Replaced
 Base: Retirees; Average: 67%True of My Retirement
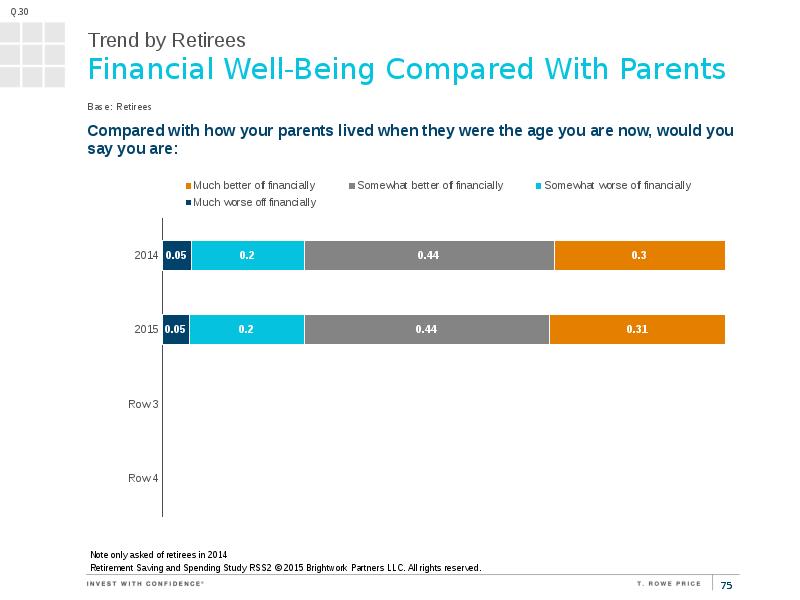
 Base: RetireesFinancial Well-Being Compared With Parents
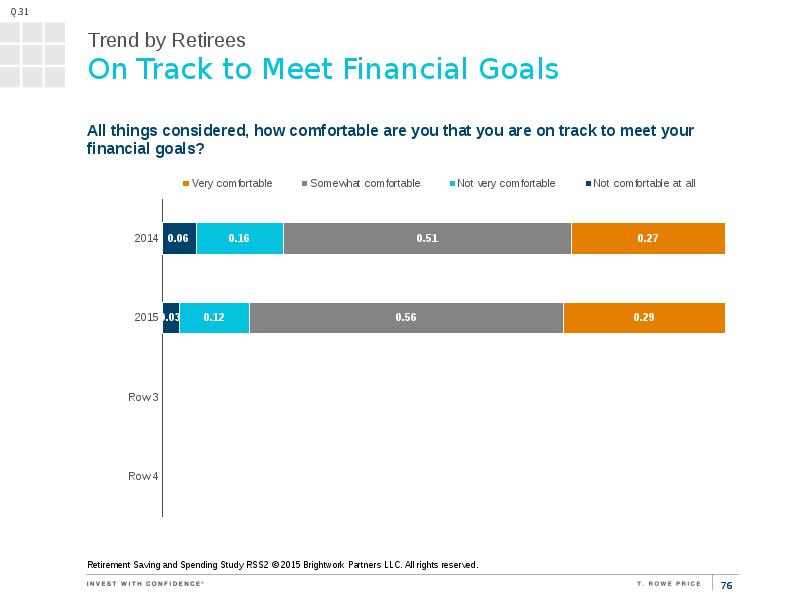
 Note only asked of retirees inOn Track to Meet Financial GoalsSatisfaction in Retirement
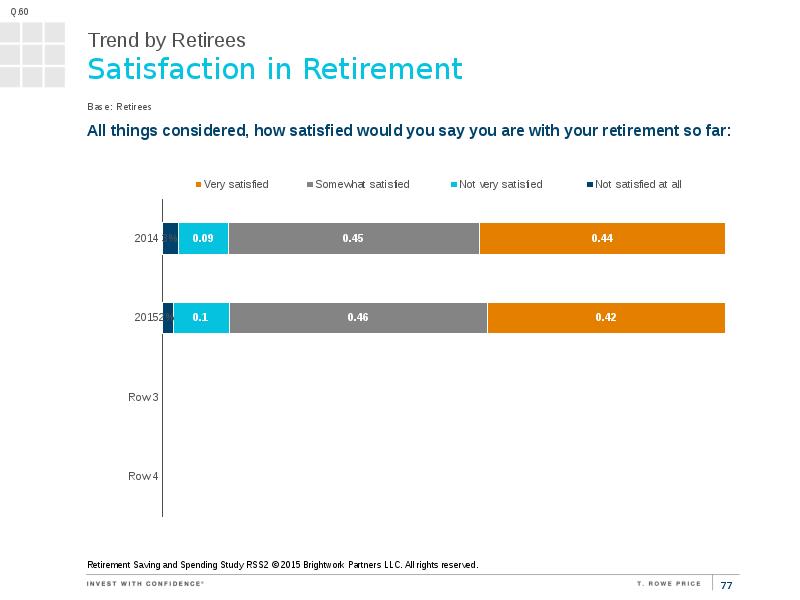
 Base: Retirees


Слайды и текст этой презентации
Слайд 1
Описание слайда:
Millennial, Gen X, and Baby Boomer Workers and Retirees Millennial, Gen X, and Baby Boomer Workers and Retirees


Слайд 2
Описание слайда:
Table of Contents Methodology Workers with 401(k)s: Millennials, Gen X, and Baby boomers Workers’ 401(k) Accounts Auto-features and Target Date Funds Saving, Spending and Advice Profiles Millennials who are eligible to participate in their employers’ 401(k) but do not (eligible but not contributing or non-savers) Retirees who saved in 401(k)s

Слайд 3
Описание слайда:
Methodology 3,026 working adults 18+ currently contributing to a 401(k) plan or eligible to contribute and having a balance of $1,000+ 1,027 adults retired in the last one to five years with a Rollover IRA or left-in-plan 401(k) balance Active participants and retirees conducted online February 19 through March 3, 2015 255 Millennials (18–33 years old) working and eligible for a 401(k) plan at current employer but not contributing and do not have a balance in that 401(k)—eligible nonparticipants (ENPs) Conducted online March 4 through March 25, 2015

Слайд 4
Описание слайда:
Workers’ 401(k) Accounts

Слайд 5
Описание слайда:
Market Value of 401(k) Plan

Слайд 6
Описание слайда:
Base: Millennial workers Base: Millennial workers

Слайд 7
Описание слайда:
Personal Deferral Rate

Слайд 8
Описание слайда:
401(k) Contribution Compared With Past 12 Months Retirement Saving and Spending Study RSS2 © 2015 Brightwork Partners LLC. All rights reserved

Слайд 9
Описание слайда:
Recommended Contribution Retirement Saving and Spending Study RSS2 © 2015 Brightwork Partners LLC. All rights reserved

Слайд 10
Описание слайда:
Increasing Your 401(k) Contribution Retirement Saving and Spending Study RSS2 © 2015 Brightwork Partners LLC. All rights reserved

Слайд 11
Описание слайда:
Reasons for Contributing Below the Maximum Retirement Saving and Spending Study RSS2 © 2015 Brightwork Partners LLC. All rights reserved

Слайд 12
Описание слайда:
Major Reasons for Contributing Below the Maximum Retirement Saving and Spending Study RSS2 © 2015 Brightwork Partners LLC. All rights reserved

Слайд 13
Описание слайда:
Influence of Match on Contribution Retirement Saving and Spending Study RSS2 © 2015 Brightwork Partners LLC. All rights reserved

Слайд 14
Описание слайда:
Retirement Expectations Retirement Saving and Spending Study RSS2 © 2015 Brightwork Partners LLC. All rights reserved

Слайд 15
Описание слайда:
Base: Workers Base: Workers

Слайд 16
Описание слайда:
Auto-Features and Target Date FUNDS

Слайд 17
Описание слайда:
True of Target Date Funds Retirement Saving and Spending Study RSS2 © 2015 Brightwork Partners LLC. All rights reserved

Слайд 18
Описание слайда:
True of Target Date Funds (cont.) Retirement Saving and Spending Study RSS2 © 2015 Brightwork Partners LLC. All rights reserved

Слайд 19
Описание слайда:
Market Value and Allocation of Assets Retirement Saving and Spending Study RSS2 © 2015 Brightwork Partners LLC. All rights reserved

Слайд 20
Описание слайда:
Satisfaction with Investments Overall Retirement Saving and Spending Study RSS2 © 2015 Brightwork Partners LLC. All rights reserved

Слайд 21
Описание слайда:
Automatic Enrollment Summary Retirement Saving and Spending Study RSS2 © 2015 Brightwork Partners LLC. All rights reserved

Слайд 22
Описание слайда:
Opt Out Rate Retirement Saving and Spending Study RSS2 © 2015 Brightwork Partners LLC. All rights reserved

Слайд 23
Описание слайда:
Base: Total workers who were enrolled automatically with the choice to opt out Base: Total workers who were enrolled automatically with the choice to opt out

Слайд 24
Описание слайда:
Attitudes About Automatic Enrollment Retirement Saving and Spending Study RSS2 © 2015 Brightwork Partners LLC. All rights reserved

Слайд 25
Описание слайда:
Automatic Escalation Retirement Saving and Spending Study RSS2 © 2015 Brightwork Partners LLC. All rights reserved

Слайд 26
Описание слайда:
Spending, saving, and advice

Слайд 27
Описание слайда:
Dealing With Money Retirement Saving and Spending Study RSS2 © 2015 Brightwork Partners LLC. All rights reserved

Слайд 28
Описание слайда:
Dealing With Money Retirement Saving and Spending Study RSS2 © 2015 Brightwork Partners LLC. All rights reserved

Слайд 29
Описание слайда:
Dealing With Money (cont.) Retirement Saving and Spending Study RSS2 © 2015 Brightwork Partners LLC. All rights reserved

Слайд 30
Описание слайда:
Managing Spending Retirement Saving and Spending Study RSS2 © 2015 Brightwork Partners LLC. All rights reserved

Слайд 31
Описание слайда:
Credit Card Spending Retirement Saving and Spending Study RSS2 © 2015 Brightwork Partners LLC. All rights reserved

Слайд 32
Описание слайда:
Managing Credit Cards Differently Retirement Saving and Spending Study RSS2 © 2015 Brightwork Partners LLC. All rights reserved

Слайд 33
Описание слайда:
#1 Funding Financial Priority Retirement Saving and Spending Study RSS2 © 2015 Brightwork Partners LLC. All rights reserved

Слайд 34
Описание слайда:
#1 Funding Financial Priority (cont.) Retirement Saving and Spending Study RSS2 © 2015 Brightwork Partners LLC. All rights reserved

Слайд 35
Описание слайда:
Sources of Funds for Emergency Retirement Saving and Spending Study RSS2 © 2015 Brightwork Partners LLC. All rights reserved

Слайд 36
Описание слайда:
Advised

Слайд 37
Описание слайда:
On Track to Meet Financial Goals

Слайд 38
Описание слайда:
Financial Well-Being Compared With Parents

Слайд 39
Описание слайда:
Perceived Job Security Base: Workers

Слайд 40
Описание слайда:
Profiles of workers with 401(k)s: Millennials, Gen X, and Baby Boomers

Слайд 41
Описание слайда:
Age Q. 2

Слайд 42
Описание слайда:
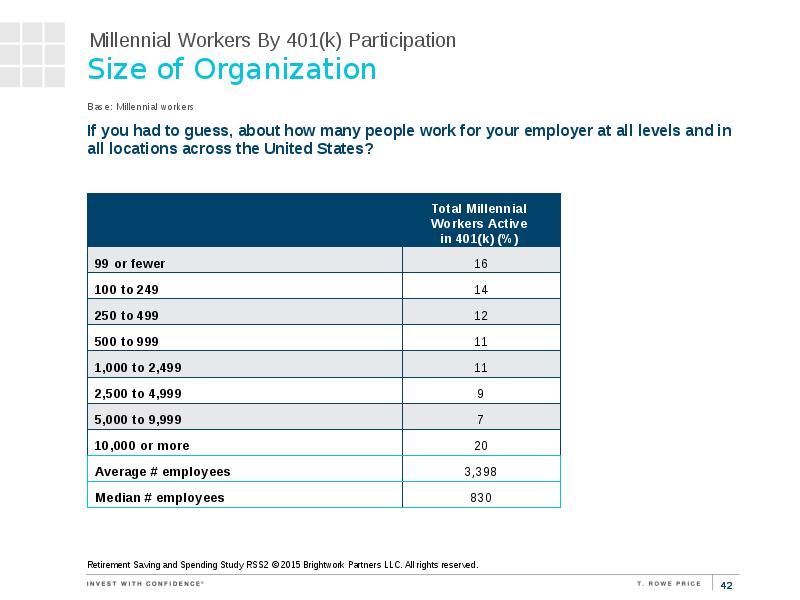
Size of Organization Retirement Saving and Spending Study RSS2 © 2015 Brightwork Partners LLC. All rights reserved.

Слайд 43
Описание слайда:
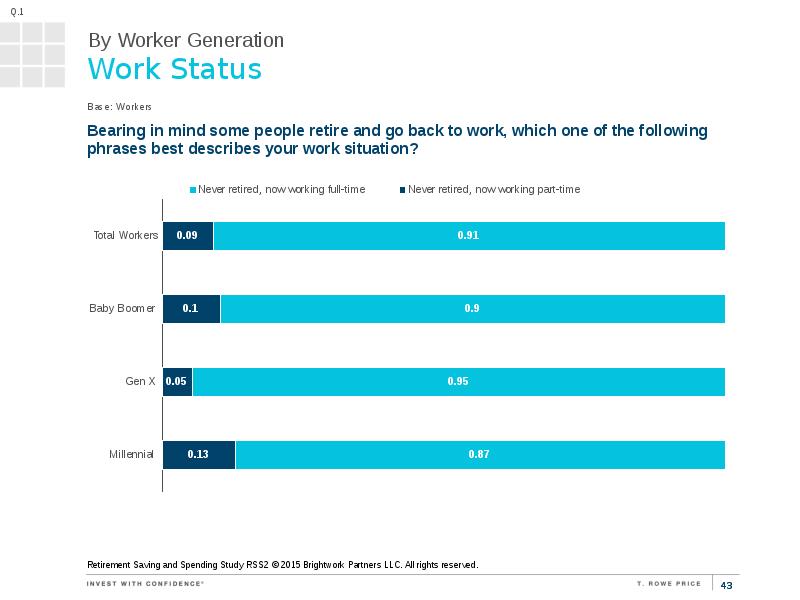
Work Status Base: Workers

Слайд 44
Описание слайда:
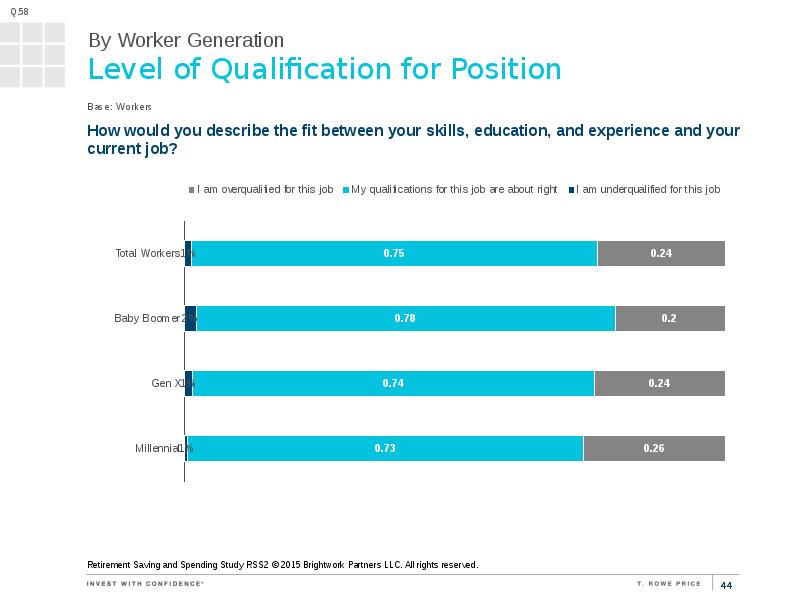
Level of Qualification for Position Base: Workers

Слайд 45
Описание слайда:
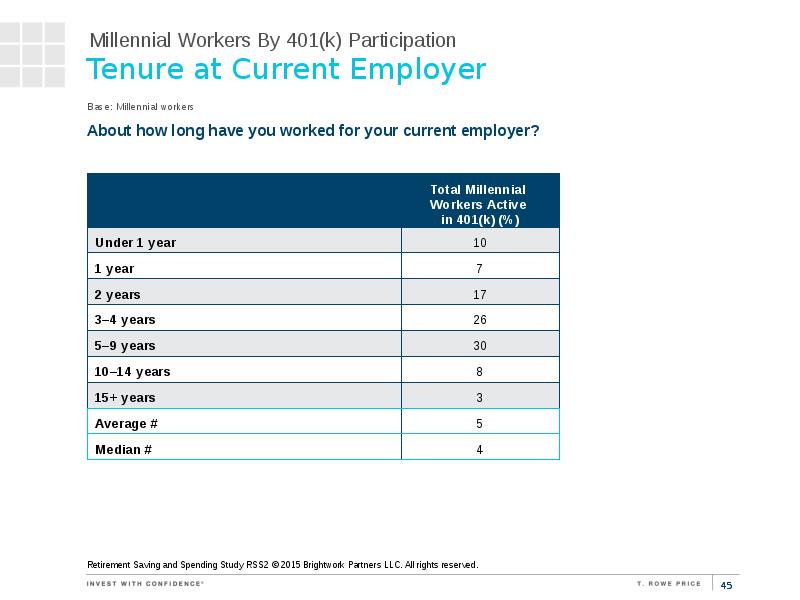
Tenure at Current Employer Base: Millennial workers

Слайд 46
Описание слайда:
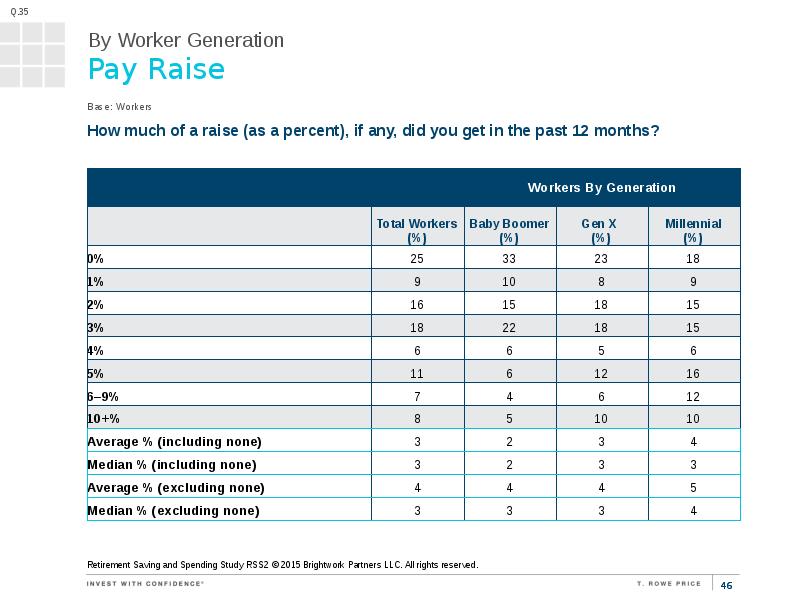
Pay Raise Base: Workers

Слайд 47
Описание слайда:
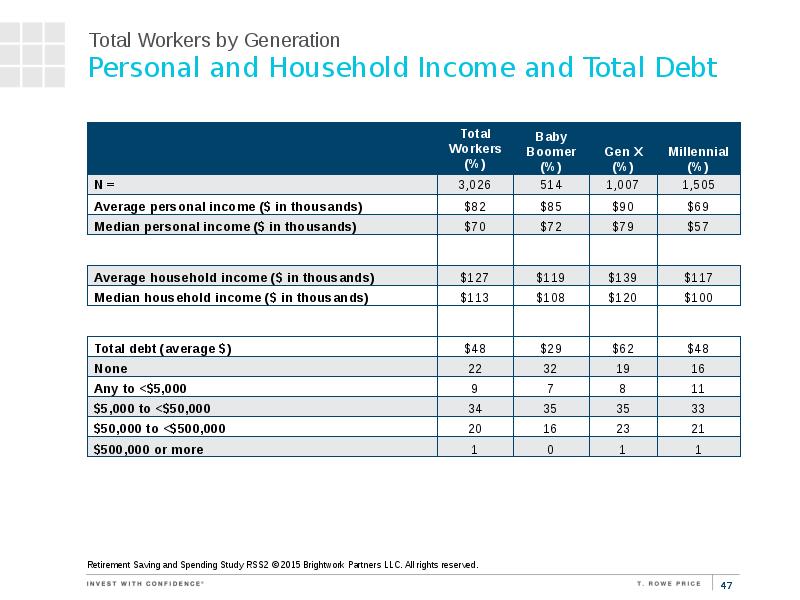
Personal and Household Income and Total Debt

Слайд 48
Описание слайда:
Millennials who are eligible to participate in their employers’ 401(k) but do not (Eligible not contributing or non-savers)

Слайд 49
Описание слайда:
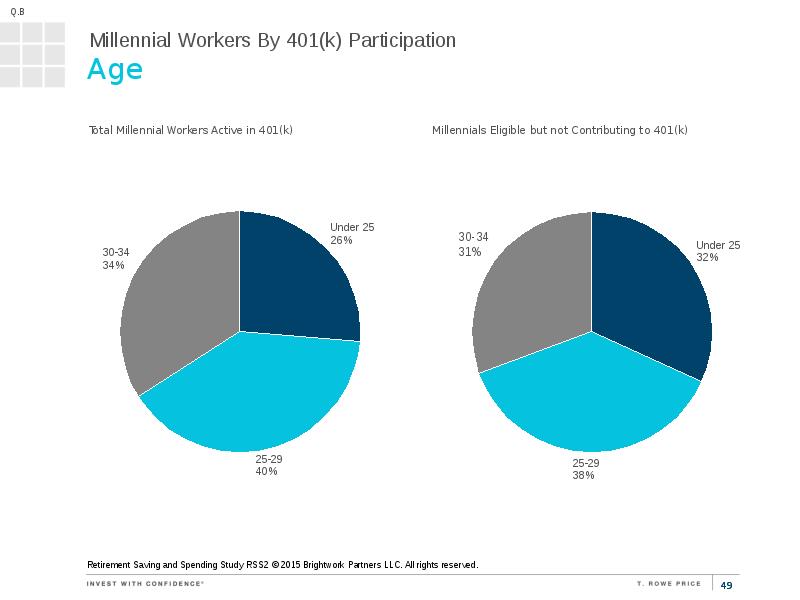
Age

Слайд 50
Описание слайда:
Gender Base: Millennial workers

Слайд 51
Описание слайда:
Education Base: Millennial workers

Слайд 52
Описание слайда:
Marital Status Base: Millennial workers

Слайд 53
Описание слайда:
Tenure at Current Employer Base: Millennial workers

Слайд 54
Описание слайда:
Pay Raise Base: Millennial workers

Слайд 55
Описание слайда:
Student Loan Debt Base: Millennial workers

Слайд 56
Описание слайда:
Direction of Debt Base: Millennial workers, have $1,000 or more in debt

Слайд 57
Описание слайда:
Dealing With Money Base: Millennial workers, describes me “very accurately"

Слайд 58
Описание слайда:
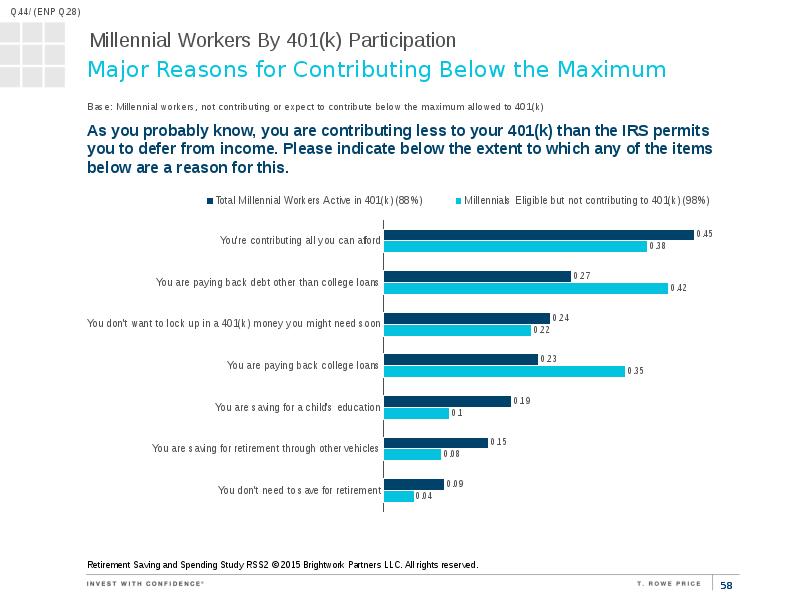
Major Reasons for Contributing Below the Maximum Base: Millennial workers, not contributing or expect to contribute below the maximum allowed to 401(k)

Слайд 59
Описание слайда:
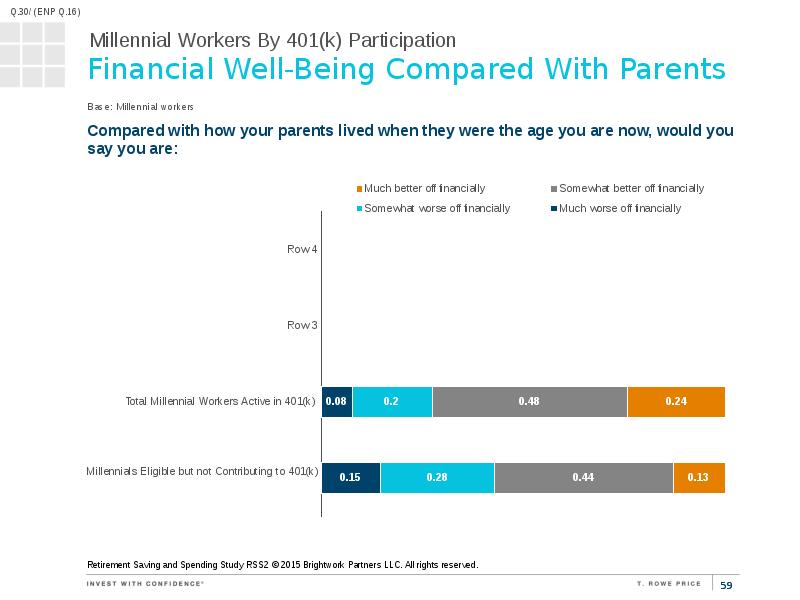
Financial Well-Being Compared With Parents Base: Millennial workers

Слайд 60
Описание слайда:
Retirees who saved in 401(k)s

Слайд 61
Описание слайда:
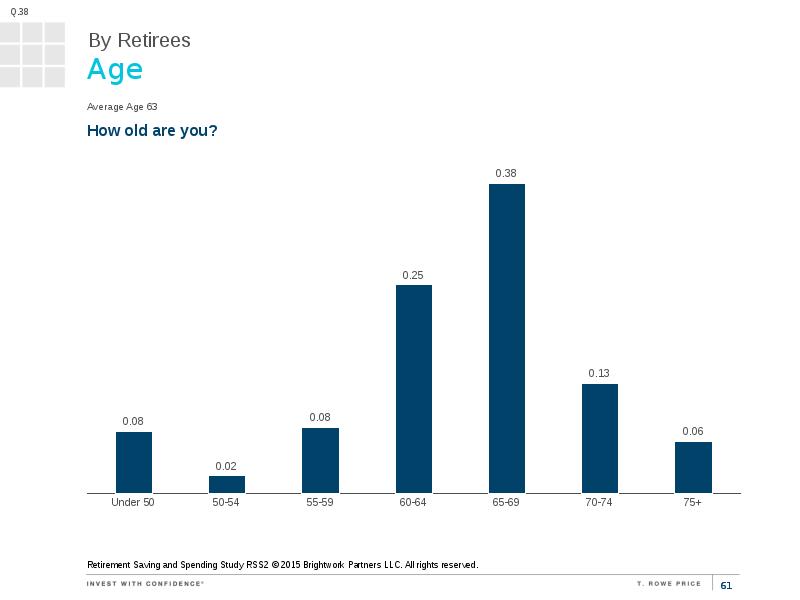
Age Average Age 63

Слайд 62
Описание слайда:
How Long Ago Retired Base: Retirees; average: 2.7 years, median 3.0 years

Слайд 63
Описание слайда:
Work Status Base: Retirees

Слайд 64
Описание слайда:
Relative Earnings Base: Retirees working full or part-time (22%)

Слайд 65
Описание слайда:
Relative Hours Base: Retirees working full or part-time (22%)

Слайд 66
Описание слайда:
Rejoined the Workforce Because... Base: Retirees working full or part-time (22%)

Слайд 67
Описание слайда:
Looking for Work Because... Base: Retirees looking for work (9%)

Слайд 68
Описание слайда:
Has a Withdrawal Plan Base: Retirees

Слайд 69
Описание слайда:
% Investable Assets Withdrawn Base: Retirees; average 5.5% (excluding none)

Слайд 70
Описание слайда:
Organizing Retirement Income "Very or Somewhat closely" Base: Retirees

Слайд 71
Описание слайда:
Sources of Retirement Income (Mean %) Base: Including none, items sum to 100%

Слайд 72
Описание слайда:
Compared With When Working Base: Retirees

Слайд 73
Описание слайда:
Proportion of Annual Income Replaced Base: Retirees; Average: 67%

Слайд 74
Описание слайда:
True of My Retirement Base: Retirees

Слайд 75
Описание слайда:
Financial Well-Being Compared With Parents Note only asked of retirees in 2014

Слайд 76
Описание слайда:
On Track to Meet Financial Goals

Слайд 77
Описание слайда:
Satisfaction in Retirement Base: Retirees


Скачать презентацию на тему Retirement Saving & Spending Study можно ниже:

Похожие презентации