Well Logging презентация
Содержание
- 2. What is well logging? Well logging, also known as borehole logging
- 3. How is well logging done? Wireline logging is performed by lowering
- 5. History of Well Logging Conrad and Marcel Schlumberger, who founded Schlumberger
- 6. History of Well Logging Oil-based mud (OBM) was first used in
- 7. History of Well Logging The gamma ray log, measuring the natural
- 8. Classification of Well Logging Logs can be classified into several types
- 9. Permeability and Lithology Logs
- 10. Gamma Ray Logging (GR) Gamma Rays are high-energy electromagnetic waves which
- 11. Spontaneous Potential Logging The spontaneous potential (SP) curve records the naturally
- 12. Caliper Log The logging system provides a continuous recording of borehole
- 13. Porosity Logs
- 14. Density Logging The formation density log is a porosity log that
- 15. Sonic (Acoustic) Log Acoustic tools measure the speed of sound waves
- 16. Neutron Logging The Neutron Log is primarily used to evaluate formation
- 17. Electrical Logs
- 18. Resistivity Logging Resistivity logging measures the subsurface electrical resistivity, which is
- 19. During logging, a current is produced within a formation and the
- 21. Caliper Logging Tool Gamma
- 22. Скачать презентацию


 was first used in")


Gamma Rays are high-energy electromagnetic waves which")
 curve records the naturally")


 Log
Acoustic tools measure the speed of sound waves")


Слайды и текст этой презентации
Слайд 1
Описание слайда:
Well Logging
Made by Daniil Velesov
Слайд 2
Описание слайда:
What is well logging?
Well logging, also known as borehole logging is the practice of making a detailed record (a well log) of the geologic formations penetrated by a borehole. The logging is based on physical measurements made by instruments lowered into the hole (geophysical logs). Some types of geophysical well logs can be done during any phase of a well's history: drilling, completing, producing, or abandoning. Well logging is performed in boreholes drilled for the oil and gas, groundwater, mineral and geothermal exploration.
Слайд 3
Описание слайда:
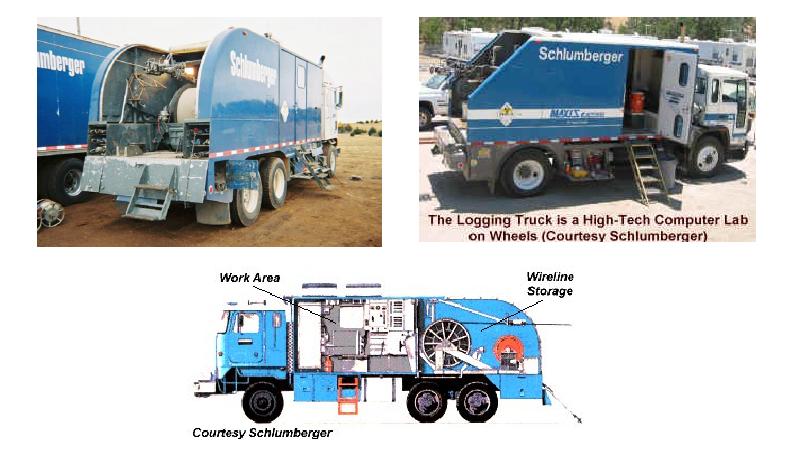
How is well logging done?
Wireline logging is performed by lowering a 'logging tool' - or a string of one or more instruments - on the end of a wireline into an oil well and recording petrophysical properties using a variety of sensors. Logging tools developed over the years measure the natural gamma ray, electrical, acoustic, stimulated radioactive responses, electromagnetic, nuclear magnetic resonance, pressure and other properties of the rocks and their contained fluids.
The data itself is recorded either at surface (real-time mode), or in the hole (memory mode) to an electronic data format and then either a printed record or electronic presentation called a "well log" is provided to the client, along with an electronic copy of the raw data. Well logging operations can either be performed during the drilling process (Logging While Drilling), to provide real-time information about the formations being penetrated by the borehole, or once the well has reached Total Depth and the whole depth of the borehole can be logged.
Слайд 4
Описание слайда:
Слайд 5
Описание слайда:
History of Well Logging
Conrad and Marcel Schlumberger, who founded Schlumberger Limited in 1926, are considered the inventors of electric well logging. Conrad developed the Schlumberger array. On September 5, 1927, a crew working for Schlumberger lowered an electric sonde or tool down a well in Pechelbronn, France creating the first well log (resistivity log).
In 1931, Henri George Doll and G. Dechatre, working for Schlumberger, discovered that the galvanometer wiggled even when no current was being passed through the logging cables down in the well. This led to the discovery of the spontaneous potential (SP) which was as important as the ability to measure resistivity.
In 1940, Schlumberger invented the dipmeter; this instrument allowed the calculation of the dip and direction of the dip of a layer.
Слайд 6
Описание слайда:
History of Well Logging
Oil-based mud (OBM) was first used in Colorado in 1948. Normal electric logs require a conductive or water-based mud, but OBMs are nonconductive. The solution to this problem was the induction log, developed in the late 1940s.
The introduction of the transistor and integrated circuits in the 1960s made electric logs vastly more reliable. Computerization allowed much faster log processing, and expanded log data-gathering capacity. The 1970s brought more logs and computers. These included combo type logs where resistivity logs and porosity logs were recorded in one pass in the borehole.
The two types of porosity logs (acoustic logs and nuclear logs) date originally from the 1940s. Sonic logs grew out of technology developed during World War II. Nuclear logging has supplemented acoustic logging, but acoustic or sonic logs are still run on some combination logging tools.
Слайд 7
Описание слайда:
History of Well Logging
The gamma ray log, measuring the natural radioactivity, was introduced by Well Surveys Inc. in 1939, and the neutron log came in 1941.
Many modern oil and gas wells are drilled directionally. At first, loggers had to run their tools somehow attached to the drill pipe if the well was not vertical. Modern techniques now permit continuous information at the surface. This is known as logging while drilling (LWD) or measurement-while-drilling (MWD).
Слайд 8
Описание слайда:
Classification of Well Logging
Logs can be classified into several types under different category
Permeability and lithology Logs
Gamma Ray Logging
Spontaneous Potential Logging
Caliper Log
Porosity Logs
Density Logging
Sonic (Acoustic) Logging
Neutron Logging
Electrical Logs
Resistivity Logging
Слайд 9
Описание слайда:
Permeability and Lithology Logs
Слайд 10
Описание слайда:
Gamma Ray Logging (GR)
Gamma Rays are high-energy electromagnetic waves which are emitted by atomic nuclei as a form of radiation
Gamma ray log is measurement of natural radioactivity in formation verses depth.
It measures the radiation emitting from naturally occurring U, Th, and K.
It is also known as shale log.
GR log reflects shale or clay content.
Clean formations have low radioactivity level.
Correlation between wells,
Determination of bed boundaries,
Evaluation of shale content within a formation,
Mineral analysis,
Depth control for side-wall coring, or perforating.
Particularly useful for defining shale beds when the SP is featureless
GR log can be run in both open and cased hole
Слайд 11
Описание слайда:
Spontaneous Potential Logging
The spontaneous potential (SP) curve records the naturally occurring electrical potential (voltage) produced by the interaction of formation connate water, conductive drilling fluid, and shale
The SP curve reflects a difference in the electrical potential between a movable electrode in the borehole and a fixed reference electrode at the surface
Though the SP is used primarily as a lithology indicator and as a correlation tool, it has other uses as well:
permeability indicator,
shale volume indicator,
porosity indicator,
formation water salinity indicator.
Слайд 12
Описание слайда:
Caliper Log
The logging system provides a continuous recording of borehole diameter versus depth.
Can be used in both soft and hard formations, run in uncased wells.
The main indicator of the log is:
Determine hole and casing diameter,
Locate caved zones,
Recognition of mud cake
When a hole diameter less than the bit size is an excellent indicator of permeability.
Слайд 13
Описание слайда:
Porosity Logs
Слайд 14
Описание слайда:
Density Logging
The formation density log is a porosity log that measures electron density of a formation
Dense formations absorb many gamma rays, while low-density formations absorb fewer. Thus, high-count rates at the detectors indicate low-density formations, whereas low count rates at the detectors indicate high-density formations.
Therefore, scattered gamma rays reaching the detector is an indication of formation density.
Слайд 15
Описание слайда:
Sonic (Acoustic) Log
Acoustic tools measure the speed of sound waves in subsurface formations. While the acoustic log can be used to determine porosity in consolidated formations, it is also valuable in other applications, such as:
Indicating lithology (using the ratio of compressional velocity over shear velocity),
Determining integrated travel time (an important tool for seismic/wellbore correlation),
Correlation with other wells
Detecting fractures and evaluating secondary porosity,
Evaluating cement bonds between casing, and formation,
Detecting over-pressure,
Determining mechanical properties (in combination with the density log), and
Determining acoustic impedance (in combination with the density log).
Слайд 16
Описание слайда:
Neutron Logging
The Neutron Log is primarily used to evaluate formation porosity, but the fact that it is really just a hydrogen detector should always be kept in mind
Слайд 17
Описание слайда:
Electrical Logs
Слайд 18
Описание слайда:
Resistivity Logging
Resistivity logging measures the subsurface electrical resistivity, which is the ability to impede the flow of electric current. This helps to differentiate between formations filled with salty waters (good conductors of electricity) and those filled with hydrocarbons (poor conductors of electricity). Resistivity and porosity measurements are used to calculate water saturation. Resistivity is expressed in ohms or ohms/meter, and is frequently charted on a logarithm scale versus depth because of the large range of resistivity. The distance from the borehole penetrated by the current varies with the tool, from a few centimeters to one meter.
Слайд 19
Описание слайда:
During logging, a current is produced within a formation and the formation’s response to the current is recorded. There are two ways that the current can be produced in the formation:
1. directly applying a current into the formation, and
2. inducing a current in the formation. If a current is directly applied to the formation, then the resistance of the current over a length of formation is measured. If a current is induced in the formation, then the conductivity of the formation is measured and inverted for the resistivity.
Слайд 20
Описание слайда:
Слайд 21
Описание слайда:
Caliper Logging Tool Gamma Ray Logging Tool
Caliper Logging Tool Gamma Ray Logging Tool
Скачать презентацию на тему Well Logging можно ниже: