1 презентация
Содержание
- 5. Agility Throughout the Business System
- 6. Enterprise Scale Agile
- 7. Cadence and Synchronization
- 9. How Metrics Can Help You Succeed Measure and improve performance Guide
- 10. How Do You Get There? Build an effective measurement plan Identify
- 11. Agile Metrics to Guide Delivery Will we meet our delivery commitments?
- 12. Agile Steering Agile Teams Will we complete our work in an
- 14. Maturity and Metrics
- 15. Maturity and Metrics
- 16. Teams: Healthy Cumulative Flow
- 17. Cumulative Flow: WTWF
- 18. Teams: Consistent Iteration Health Message
- 19. Delivery: Release Tracking
- 20. Delivery: Plan and Milestone Progress
- 21. Delivery: Initiative Progress
- 22. Delivery: Feature Responsiveness
- 23. Delivery: Performance Consistency
- 24. Data-driven Continuous Improvement How do we achieve our goals over time?
- 25. Performance Metrics Support Outcomes Performance KPIs Are our teams healthy? How
- 27. Findings
- 28. SDPI Dimensions
- 29. The Impact of Agile Quantified
- 30. Work Interacts (Through Workers) …
- 31. Work in Process
- 32. Limit WiP
- 33. Stable Teams
- 34. Boost Efficiency and Innovation
- 35. Recommendations Limit WiP If practicing Scrum, use two-week iterations; task
- 36. Traps What will impede our outcomes?
- 37. Common Metrics Traps Manipulation Unbalanced metrics Costly KPIs Availability bias Mechanical
- 38. False Negatives
- 39. Data Integrity Checks for Insights Quality stories (avoid stories that are
- 40. Use Case: Annual Company Disruptions
- 41. To Learn More... The Seven Deadly Sins of Agile Measurement Whitepaper
- 43. Скачать презентацию


 …")


Слайды и текст этой презентации
Слайд 1
Описание слайда:
Слайд 2
Описание слайда:
Слайд 3
Описание слайда:
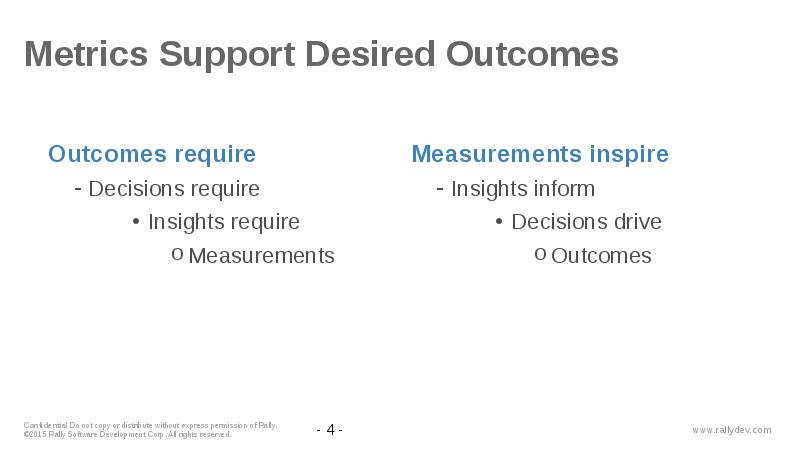
Слайд 4
Описание слайда:
Слайд 5
Описание слайда:
Agility Throughout the Business System
Слайд 6
Описание слайда:
Enterprise Scale Agile
Слайд 7
Описание слайда:
Cadence and Synchronization
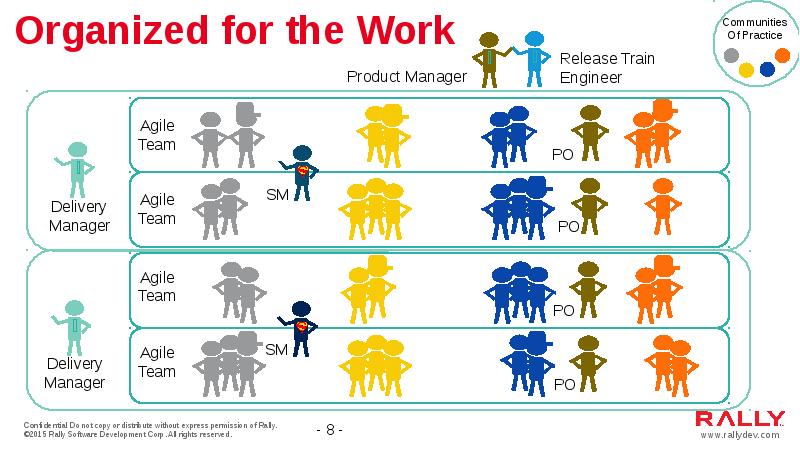
Слайд 8
Описание слайда:
Слайд 9
Описание слайда:
How Metrics Can Help You Succeed
Measure and improve performance
Guide team execution and value delivery
Correlate value delivered with strategic priorities
Слайд 10
Описание слайда:
How Do You Get There?
Build an effective measurement plan
Identify traps and actively manage them
Inspect and adapt!
Слайд 11
Описание слайда:
Agile Metrics to Guide Delivery
Will we meet our delivery commitments?
Слайд 12
Описание слайда:
Agile Steering
Agile Teams
Will we complete our work in an iteration (stories, tasks, defects, etc.)?
Agile Delivery Groups
Will we meet our plan objectives (features, milestones, quality, etc.)?
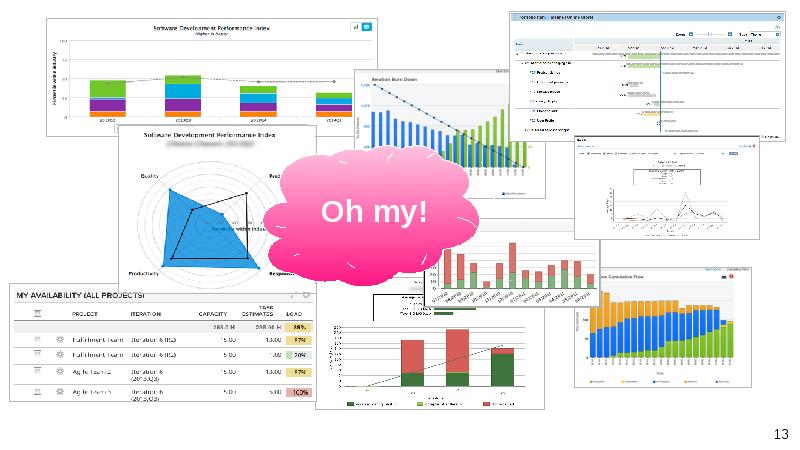
Слайд 13
Описание слайда:
Слайд 14
Описание слайда:
Maturity and Metrics
Слайд 15
Описание слайда:
Maturity and Metrics
Слайд 16
Описание слайда:
Teams: Healthy Cumulative Flow
Слайд 17
Описание слайда:
Cumulative Flow: WTWF
Слайд 18
Описание слайда:
Teams: Consistent Iteration Health Message
Слайд 19
Описание слайда:
Delivery: Release Tracking
Слайд 20
Описание слайда:
Delivery: Plan and Milestone Progress
Слайд 21
Описание слайда:
Delivery: Initiative Progress
Слайд 22
Описание слайда:
Delivery: Feature Responsiveness
Слайд 23
Описание слайда:
Delivery: Performance Consistency
Слайд 24
Описание слайда:
Data-driven Continuous Improvement
How do we achieve our goals over time?
Слайд 25
Описание слайда:
Performance Metrics Support Outcomes
Performance KPIs
Are our teams healthy?
How much can we predictably deliver?
What improvements would we value most?
What improvement action will we try next?
Слайд 26
Описание слайда:
Слайд 27
Описание слайда:
Findings
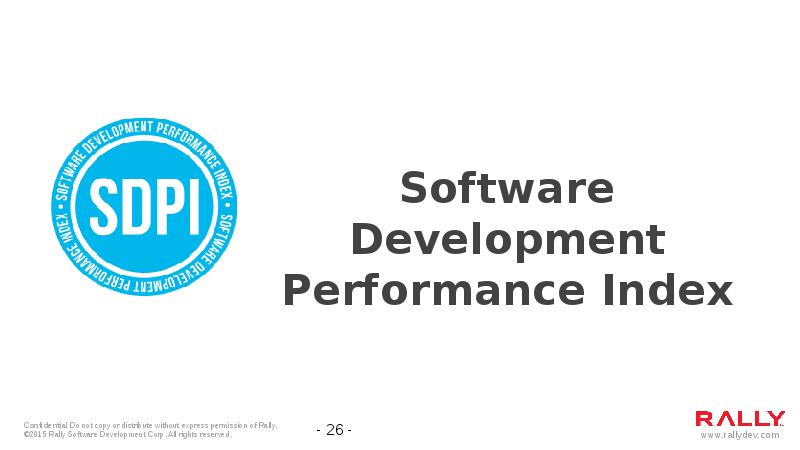
Слайд 28
Описание слайда:
SDPI Dimensions
Слайд 29
Описание слайда:
The Impact of Agile Quantified
Слайд 30
Описание слайда:
Work Interacts (Through Workers) …
Слайд 31
Описание слайда:
Work in Process
Слайд 32
Описание слайда:
Limit WiP
Слайд 33
Описание слайда:
Stable Teams
Слайд 34
Описание слайда:
Boost Efficiency and Innovation
Слайд 35
Описание слайда:
Recommendations
Limit WiP
If practicing Scrum, use two-week iterations; task out stories
Size teams appropriately: 7 +/- 2 for balanced performance (larger teams are okay)
Have dedicated and stable teams
Encourage small stories
Слайд 36
Описание слайда:
Traps
What will impede our outcomes?
Слайд 37
Описание слайда:
Common Metrics Traps
Manipulation
Unbalanced metrics
Costly KPIs
Availability bias
Mechanical decision-making
False negatives
Слайд 38
Описание слайда:
False Negatives
Слайд 39
Описание слайда:
Data Integrity Checks for Insights
Quality stories
(avoid stories that are really tasks and/or fake stories)
Mapping kanban states to schedule state values
(especially in-progress and accepted)
Quantity of in-progress split stories
(splitting stories at the end of the iteration)
Defect state value accuracy
Consistent use of defect environment field value
Consistent use of defect priority field
Слайд 40
Описание слайда:
Use Case: Annual Company Disruptions
Слайд 41
Описание слайда:
To Learn More...
The Seven Deadly Sins of Agile Measurement Whitepaper
The Impact of Agile Quantified: SDPI Whitepaper
Agile Reports and Metrics Rally Help
Rally Success Program
Слайд 42
Описание слайда:
Скачать презентацию на тему 1 можно ниже: