Q3 2014 презентация
Содержание
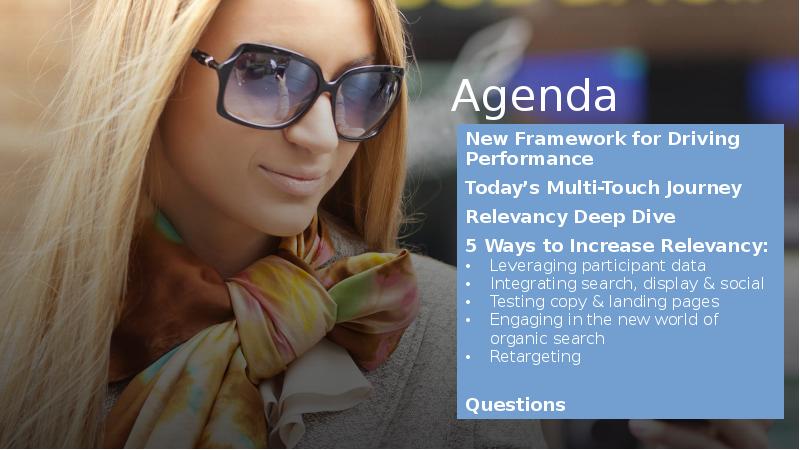
- 4. Performance Activation Framework Visibility Find participants across channels & devices
- 5. Today’s Fluid Multi-Touch Journey
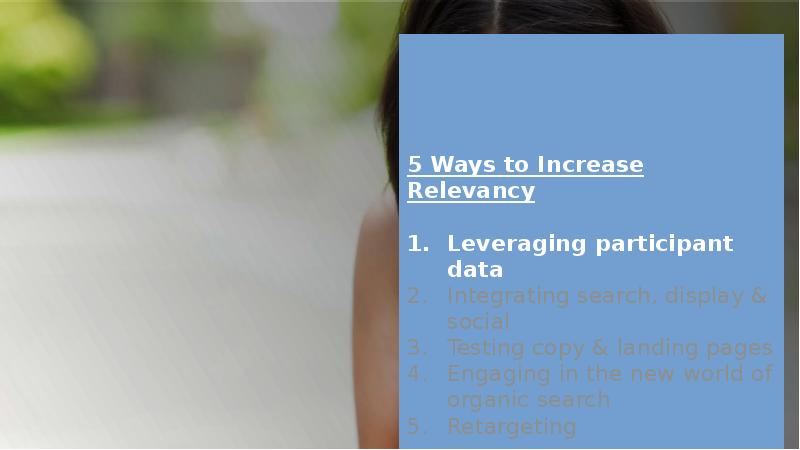
- 7. Leveraging Participant Data See people through data Participant insights Social chatter
- 8. Participant Data in Action Challenge Software client needed to be nimble
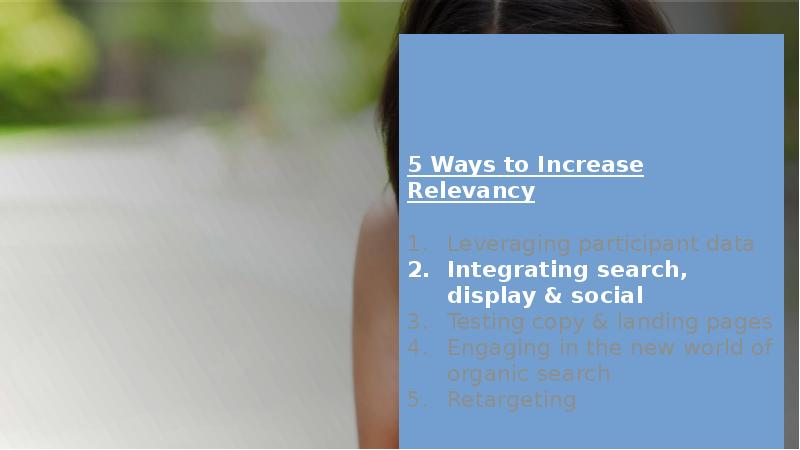
- 10. Integrating Search, Display & Social Understand competitive/ participant landscape Right person,
- 11. Integration in Action Challenge Entertainment client sought to increase brand keyword
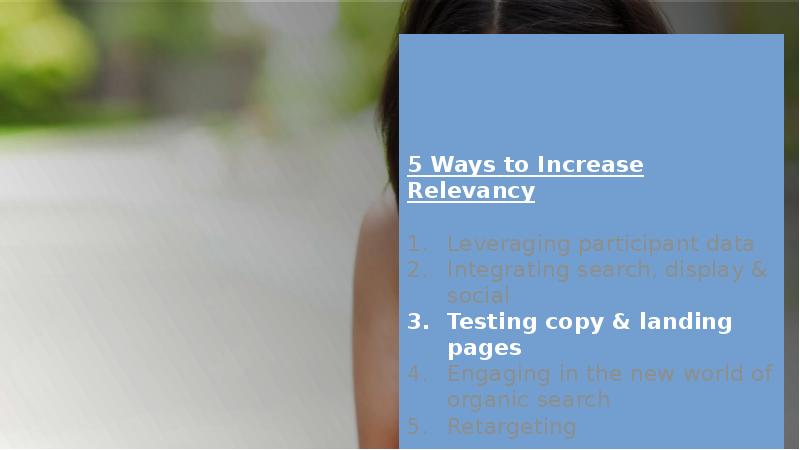
- 13. Keys to Testing Define success Purchase, find store, sign-up Optimize to
- 14. Landing Page Testing in Action
- 15. Copy/Creative: Testing
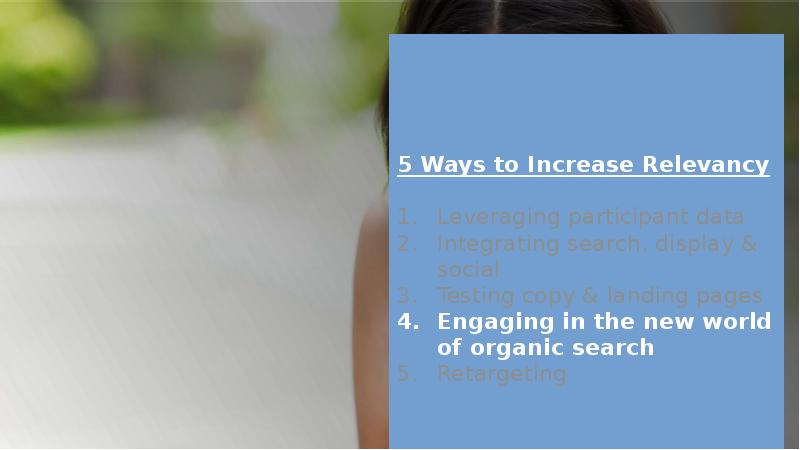
- 17. The New World of Organic Search
- 18. Organic in Action
- 19. Lead Gen Client: Results
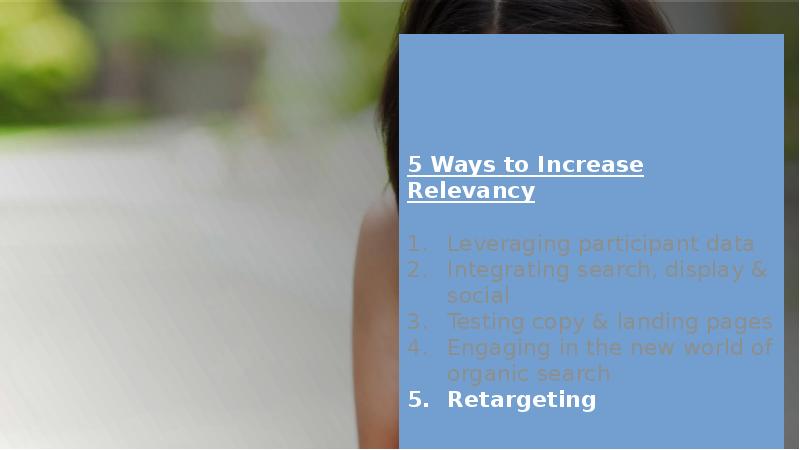
- 21. Driving Relevancy through Search Retargeting
- 23. Скачать презентацию


Слайды и текст этой презентации
Слайд 1
Описание слайда:
Слайд 2
Описание слайда:
Слайд 3
Описание слайда:
Слайд 4
Описание слайда:
Performance Activation Framework
Visibility
Find participants across channels & devices
Relevancy
Create experiences that break through
clutter & drive qualified clicks
Conversion
Activate clicks, actions, leads, sales
Optimization
Continually improve results
Слайд 5
Описание слайда:
Today’s Fluid Multi-Touch Journey
Слайд 6
Описание слайда:
Слайд 7
Описание слайда:
Leveraging Participant Data
See people through data
Participant insights
Social chatter
Search keywords
Browsing data
Demographics
Create experiences that
are already optimized
because they’re informed
by participant engagement
metrics uncovered via
analytics
Слайд 8
Описание слайда:
Participant Data in Action
Challenge
Software client needed to be nimble to capitalize on buzz, in real-time, around new product announcement
Strategy
On launch day, we implemented bids, keywords & copy based on dynamic participant data. We noticed higher-than-expected social conversations trending in anticipation; we used these insights to build/refine copy & keywords.
Results
On announcement day, relevant ads drove 328% higher-than-average CTR, an all-time high
Слайд 9
Описание слайда:
Слайд 10
Описание слайда:
Integrating Search, Display & Social
Understand competitive/
participant landscape
Right person, Right
channel, right device
Create cross-channel,
online-offline attribution
plans, media-mix models
Enable data collection
via tagging
Collect, report, optimize; shift
budget in real-time to
pounce on performance
Слайд 11
Описание слайда:
Integration in Action
Challenge
Entertainment client sought to
increase brand keyword search volume
Strategy
Expand beyond paid search to display &
social with theory that visibility would create demand in search
We tailored messaging through the journey
Results
Brand search volume increased 21% in the 1st month & 46% in the 2nd
Proof that display & social can not only drive direct conversions, but also fuel search
Слайд 12
Описание слайда:
Слайд 13
Описание слайда:
Keys to Testing
Define success
Purchase, find store, sign-up
Optimize to success metrics
Create pre-click (ads) &
post-click (landing page)
experiences that convert
Big ROI lies beyond the click
Yet for every $92 spent acquiring visitors, only $1 is spent converting them*
We routinely see 100%+ conversion rate increases via landing page testing (A/B, multivariate)
Never stop testing & learning
Слайд 14
Описание слайда:
Landing Page Testing in Action
Слайд 15
Описание слайда:
Copy/Creative: Testing
Слайд 16
Описание слайда:
Слайд 17
Описание слайда:
The New World of Organic Search
Слайд 18
Описание слайда:
Organic in Action
Слайд 19
Описание слайда:
Lead Gen Client: Results
Слайд 20
Описание слайда:
Слайд 21
Описание слайда:
Driving Relevancy through Search Retargeting
Слайд 22
Описание слайда:
Скачать презентацию на тему Q3 2014 можно ниже: