Data coding and screening презентация
Содержание
- 2. WHAT IS DATA CODING? “A systematic way in which to condense
- 4. WHEN TO CODE When testing a hypothesis (deductive), categories and codes
- 5. LEVELS OF CODING (FOR QUALITATIVE DATA) Open Break down, compare, and
- 6. WHY DO DATA CODING? It lets you make sense of and
- 7. DATA SCREENING Used to identify miscoded, missing, or messy data Find
- 8. DETERMINING CODES (BOURQUE, 2004) For surveys or questionnaires, codes are finalized
- 9. IMPORTANCE OF CODEBOOK (SHENTON, 2004) Allows study to be repeated and
- 10. DETERMINING CODES, CONT. Exhaustive – a unique code number has been
- 11. DETERMINING CODES, CONT. Missing Data - includes conditions such as “refused,”
- 12. CREATING CODE FRAME PRIOR TO DATA COLLECTION (BOURQUE, 2004; EPSTEIN &
- 13. TABLE OF CODE VALUES (EPSTEIN & MARTIN, 2005)
- 14. TRANSCRIPT (SHENTON, 2004) Appropriate for open-ended answers as in focus groups,
- 15. THREE PARTS TO TRANSCRIPT (SHENTON, 2004) Background information, ex. time, date,
- 16. POSTCODING (SHENTON, 2004) Post-meeting observations Post-transcript review a. Compilation of insightful
- 17. DATA DICTIONARY (SHENTON, 2004)
- 18. REFERENCES Bourque, Linda B. "Coding." In The Sage Encyclopedia of Social
- 20. Coding Mixed Methods: Advantages and Disadvantages
- 21. Position 1 v. Position 2 “When compared to quantitative research, qualitative
- 22. Move Toward P1 and P2 Cooperation Cooperation – last 25 years
- 23. Advantages of Mixed Methods: Improves validity of findings More in-depth data
- 24. Disadvantages of Mixed Methods Inequality in data sets “Data sets must
- 25. Key Point in Coding Mixed Methods Data “The issue to be
- 26. Examining a Mixed Methods Research Study Makani, S. & Wooshue, K.
- 27. Study Details Population: Purposive population, 10 undergraduates (2 groups) / 5
- 28. Methods Data: Used both qualitative and qualitative data collected through a
- 29. Study Observations Followed 3 groups of business students working on group
- 30. Coding Methods Used pre-selected codes from literature review: Time Efficiency of
- 31. Coding: Ordinal Measures Opinion Survey What sources do you use to
- 32. Examples of Ratio-Interval Coding and Level of Measurement The age of
- 33. Study Conclusions This study reveals that in order to create an
- 34. Study Weaknesses: Use of Mixed Methods Data No discussion of how
- 35. Study Advantages: Use of Mixed Methods Data Numeric data helped create
- 36. OUTLIERS IN DATA ANALYSIS
- 37. WHAT IS AN OUTLIER? Miller (1981): '... An outlier is a
- 38. WHY ARE OUTLIERS IMPORTANT IN DATA ANALYSIS? Outliers can influence the
- 39. ISSUES CONCERNING OUTLIERS Rejection of Outliers “From the earliest efforts to
- 40. What do we do with outliers? There are four basic ways
- 41. A CLASSIC EXAMPLE ON THE USE OF OUTLIERS Hadlum vs. Hadlum
- 43. Sources Barnett, Vic. 1978. The study of outliers: purpose and models.
- 44. Скачать презентацию


, categories and codes")

Open
Break down, compare, and")


For surveys or questionnaires, codes are")

Allows study to be repeated")


")

Appropriate for open-ended answers as in focus groups,")

Background information, ex. time,")

Post-meeting observations
Post-transcript review
a. Compilation of insightful")
")


 / 5")


: '... An outlier is a")


Слайды и текст этой презентации
Слайд 1
Описание слайда:
DATA CODING AND SCREENING
Jessica True
Mike Cendejas
Krystal Appiah
Amy Guy
Rachel Pacas
Слайд 2
Описание слайда:
WHAT IS DATA CODING?
“A systematic way in which to condense extensive data sets into smaller analyzable units through the creation of categories and concepts derived from the data.”1
“The process by which verbal data are converted into variables and categories of variables using numbers, so that the data can be entered into computers for analysis.”2
Lockyer, Sharon. "Coding Qualitative Data." In The Sage Encyclopedia of Social Science Research Methods, Edited by Michael S. Lewis-Beck, Alan Bryman, and Timothy Futing Liao, v. 1, 137-138. Thousand Oaks, Calif.: Sage, 2004.
Bourque, Linda B. "Coding." In The Sage Encyclopedia of Social Science Research Methods, Edited by Michael S. Lewis-Beck, Alan Bryman, and Timothy Futing Liao, v. 1, 132-136. Thousand Oaks, Calif.: Sage, 2004.
Слайд 3
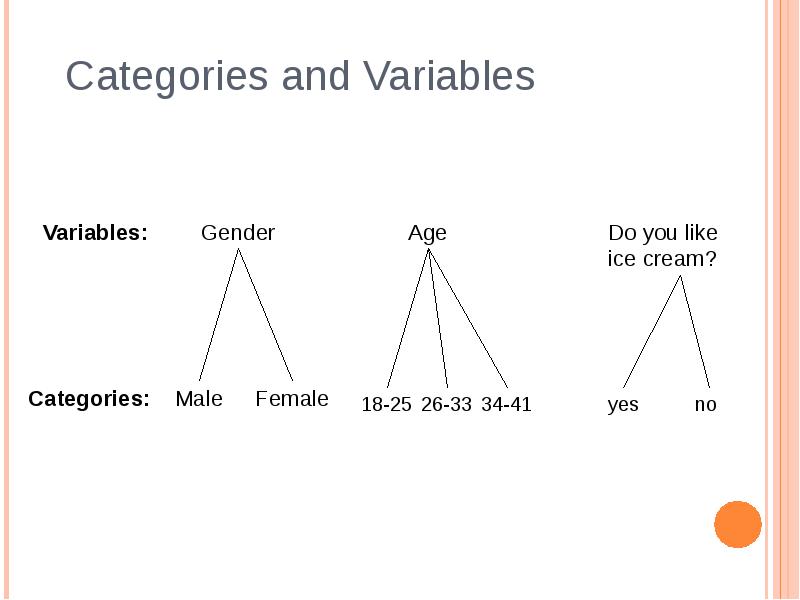
Описание слайда:
Слайд 4
Описание слайда:
WHEN TO CODE
When testing a hypothesis (deductive), categories and codes can be developed before data is collected.
When generating a theory (inductive), categories and codes are generated after examining the collected data.
Content analysis
How will the data be used?
Слайд 5
Описание слайда:
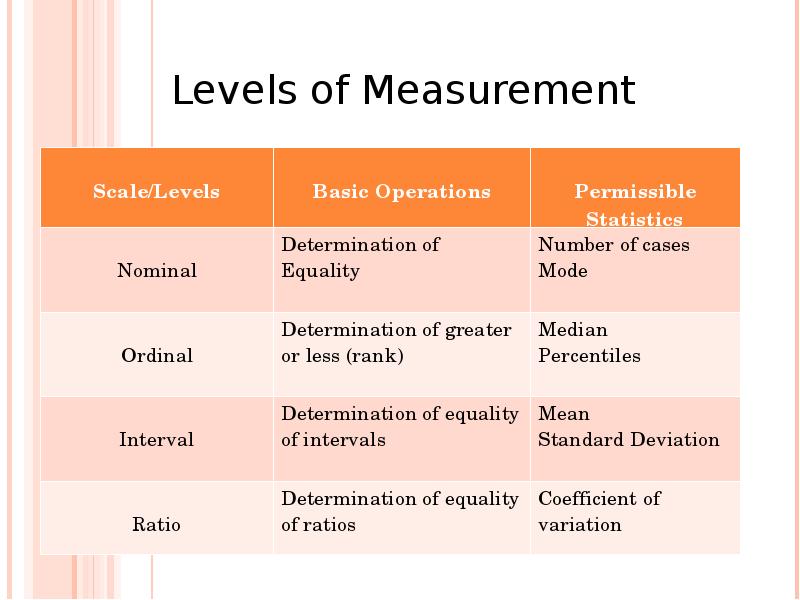
LEVELS OF CODING
(FOR QUALITATIVE DATA)
Open
Break down, compare, and categorize data
Axial
Make connections between categories after open coding
Selective
Select the core category, relate it to other categories and confirm and explain those relationships
Слайд 6
Описание слайда:
WHY DO DATA CODING?
It lets you make sense of and analyze your data.
For qualitative studies, it can help you generate a general theory.
The type of statistical analysis you can use depends on the type of data you collect, how you collect it, and how it’s coded.
“Coding facilitates the organization, retrieval, and interpretation of data and leads to conclusions on the basis of that interpretation.”1
Слайд 7
Описание слайда:
DATA SCREENING
Used to identify miscoded, missing, or messy data
Find possible outliers, non-normal distributions, other anomalies in the data
Can improve performance of statistical methods
Screening should be done with particular analysis methods in mind
Слайд 8
Описание слайда:
DETERMINING CODES
(BOURQUE, 2004)
For surveys or questionnaires, codes are finalized as the questionnaire is completed
For interviews, focus groups, observations, etc. , codes are developed inductively after data collection and during data analysis
Слайд 9
Описание слайда:
IMPORTANCE OF CODEBOOK
(SHENTON, 2004)
Allows study to be repeated and validated.
Makes methods transparent by recording analytical thinking used to devise codes.
Allows comparison with other studies.
Слайд 10
Описание слайда:
DETERMINING CODES, CONT.
Exhaustive – a unique code number has been created for each category ex. if religions are the category, also include agnostic and atheist
Mutually Exclusive – information being coded can only be assigned to one category
Residual other – allows for the participant to provide information that was not anticipated, i.e. “Other” _______________
Слайд 11
Описание слайда:
DETERMINING CODES, CONT.
Missing Data - includes conditions such as “refused,” “not applicable,” “missing,” “don’t know”
Heaping – is the condition when too much data falls into same category, ex. college undergraduates in 18-21 range (variable becomes useless because it has no variance)
Слайд 12
Описание слайда:
CREATING CODE FRAME
PRIOR TO DATA COLLECTION
(BOURQUE, 2004; EPSTEIN & MARTIN, 2005)
Use this when know number of variables and range of probable data in advance of data collection, e.g. when using a survey or questionnaire
Use more variables rather than fewer
Do a pre-test of questions to help limit “other” responses
Слайд 13
Описание слайда:
TABLE OF CODE VALUES
(EPSTEIN & MARTIN, 2005)
Слайд 14
Описание слайда:
TRANSCRIPT (SHENTON, 2004)
Appropriate for open-ended answers as in focus groups, observation, individual interviews, etc.
Strengthens “audit trail” since reviewers can see actual data
Use identifiers that anonymize participant but still reveal information to researcher
ex. Y10/B-3/II/83 or “Mary”
Слайд 15
Описание слайда:
THREE PARTS TO TRANSCRIPT
(SHENTON, 2004)
Background information, ex. time, date, organizations involved, participants.
Verbatim transcription (if possible, participants should verify for accuracy)
Observations made by researcher after session, ex. diagram showing seating, intonation of speakers, description of room
Слайд 16
Описание слайда:
POSTCODING (SHENTON, 2004)
Post-meeting observations
Post-transcript review
a. Compilation of insightful quotations
b. Preliminary theme tracking
c. Identification of links to previous work
Create categories and definitions of codes
Слайд 17
Описание слайда:
DATA DICTIONARY (SHENTON, 2004)
Слайд 18
Описание слайда:
REFERENCES
Bourque, Linda B. "Coding." In The Sage Encyclopedia of Social Science Research Methods. Eds. Michael S. Lewis-Beck, Alan Bryman, and Timothy Futing Liao, v. 1, 132-136. Thousand Oaks, Calif.: Sage, 2004.
Lee, Epstein and Andrew Martin. "Coding Variables." In The Encyclopedia of Social Measurement. Ed. Kimberly Kempf-Leonard, v.1, 321-327. New York: Elsevier Academic Press, 2005.
Shenton, Andrew K. “The analysis of qualitative data in LIS research projects: A possible approach.” Education for Information 22 (2004): 143-162.
Слайд 19
Описание слайда:
Слайд 20
Описание слайда:
Coding Mixed Methods:
Advantages and Disadvantages
Слайд 21
Описание слайда:
Position 1 v. Position 2
“When compared to quantitative research, qualitative research is perceived as being less rigorous, primarily because it may not include statistics and all the mumbo jumbo that goes with extensive statistical analysis. Qualitative and quantitative research methods in librarianship and information science are not simply different ways of doing the same thing.”
Source: Riggs, D.E. (1998). Let us stop apologizing for qualitative research. College & Research Libraries, 59(5).
Retrieved from: http://www.ala.org/ala/acrl/acrlpubs/crljournal/backissues1998b/september98/ALA_print_layout_1_179518_179518.cfm
Слайд 22
Описание слайда:
Move Toward P1 and P2 Cooperation
Cooperation – last 25 years –
Limitations of only using one method:
Quantitative – lack of thick description
Qualitative – lacks visual presentation of numbers
Source: Grbich, Carol. “Incorporating Data from Multiple Sources.” In Qualitative Data Analysis. (Thousand Oaks, Calif.: Sage Publications, 2007): 195-204.
Слайд 23
Описание слайда:
Advantages of Mixed Methods:
Improves validity of findings
More in-depth data
Increases your capacity to cross-check one data set against another
Provides detail of individual experiences behind the statistics
More focused questionnaire
Further in-depth interviews can be used to tease out problems and seek solutions
Слайд 24
Описание слайда:
Disadvantages of Mixed Methods
Inequality in data sets
“Data sets must be properly designed, collected, and analyzed”
“Numerical data set treated less theoretically, mere proving of hypothesis”
Presenting both data sets can overwhelm the reader
Synthesized findings might be “dumbed-down” to make results more readable
Source: Grbich, Carol. “Incorporating Data from Multiple Sources.” In Qualitative Data Analysis. (Thousand Oaks, Calif.: Sage Publications, 2007): 195-204.
Слайд 25
Описание слайда:
Key Point in Coding
Mixed Methods Data
“The issue to be most concerned about in mixed methods is ensuring that your qualitative data have not been poorly designed, badly collected, and shallowly analyzed.”
Source: Grbich, Carol. “Incorporating Data from Multiple Sources.” In Qualitative Data Analysis. (Thousand Oaks, Calif.: Sage Publications, 2007): 195-204.
Слайд 26
Описание слайда:
Examining a Mixed Methods Research Study
Makani, S. & Wooshue, K. (2006). Information seeking behaviors of business students and the development of academic digital libraries. Evidence Based Library and Information Practice, 1(4), 30-45.
Слайд 27
Описание слайда:
Study Details
Population: Purposive population, 10 undergraduates (2 groups) / 5 graduate students
Undergraduate business students at Dalhousie University in Canada
Objectives: To explore the information-seeking behaviors of business students at Dalhousie University in Canada to determine if these behaviors should direct the design and development of digital academic libraries.
Слайд 28
Описание слайда:
Methods
Data: Used both qualitative and qualitative data collected through a survey, in-depth semi-structured interviews, observation, and document analysis.
Qualitative case study data was coded using QSR N6 qualitative data analysis software.
Слайд 29
Описание слайда:
Study Observations
Followed 3 groups of business students working on group project assignments. The assignments involved formulating a topic, searching for information and writing and submitting a group project report.
Слайд 30
Описание слайда:
Coding Methods
Used pre-selected codes from literature review:
Time
Efficiency of use
Cost
Actors
Objects (research sources)
Слайд 31
Описание слайда:
Coding: Ordinal Measures
Opinion Survey
What sources do you use to get started on your research?
Слайд 32
Описание слайда:
Examples of Ratio-Interval Coding and Level of Measurement
The age of the survey participants (survey and group study) ranged from 18 – 45 years.
Most of the undergraduates were between 18 and 25 years of age (95%)
While 56% of graduate students fell within the same age range.
Слайд 33
Описание слайда:
Study Conclusions
This study reveals that in order to create an effective business digital library, an understanding of how the targeted users do their work, how they use information, and how they create knowledge is essential factors in creating a digital library for business students.
Слайд 34
Описание слайда:
Study Weaknesses: Use of Mixed Methods Data
No discussion of how the survey was delivered electronically
Survey questions were not included in the published article
Created for a long results section
Слайд 35
Описание слайда:
Study Advantages: Use of Mixed Methods Data
Numeric data helped create a clearer picture of the participants
Numeric data from the survey questions nicely compliments the excerpts from the semi-structured interviews
Слайд 36
Описание слайда:
OUTLIERS IN DATA ANALYSIS
Слайд 37
Описание слайда:
WHAT IS AN OUTLIER?
Miller (1981): '... An outlier is a single observation or single mean which does not conform with the rest of the data... .’
Barnett & Lewis (1984): '... An outlier in a set of data is an observation which appears to be inconsistent with the remainder of that set of data....'
Слайд 38
Описание слайда:
WHY ARE OUTLIERS IMPORTANT IN DATA ANALYSIS?
Outliers can influence the analysis of a set of data
Objective analysis should be done in order to determine the cause of an outlier appearing in a data set
Слайд 39
Описание слайда:
ISSUES CONCERNING OUTLIERS
Rejection of Outliers
“From the earliest efforts to harness and employ the information implicit in collected data there has been concern for “unrepresentative”, “rogue”, “spurious”, “maverick”, or “outlying” observations in a data set. What should we do about the “outliers” in a sample: Should we automatically reject them, as alien contaminants, thus restoring the integrity of the data set or take no notice of them unless we have overt practical evidence that they are unrepresentative?”
Слайд 40
Описание слайда:
What do we do with outliers?
There are four basic ways in which outliers can be handled:
The outlier can be accommodated into the data set through sophisticated statistical refinements
An outlier can be incorporated by replacing it with another model
The outlier can be used identify another important feature of the population being analyzed, which can lead to new experimentation
If other options are of no alternative, the outlier will be rejected and regarded as a “contaminant” of the data set
Слайд 41
Описание слайда:
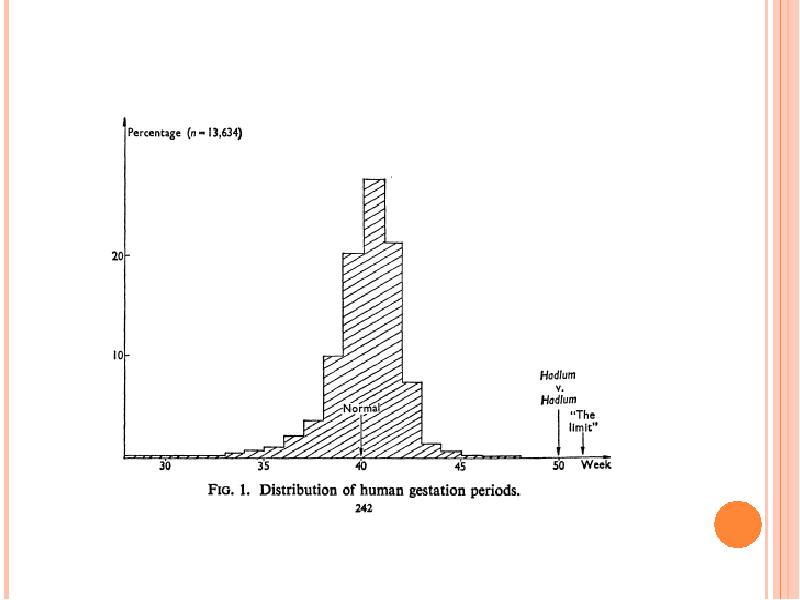
A CLASSIC EXAMPLE ON THE USE OF OUTLIERS
Hadlum vs. Hadlum (1949)
Слайд 42
Описание слайда:
Слайд 43
Описание слайда:
Sources
Barnett, Vic. 1978. The study of outliers: purpose and models. Applied Statistics 27: 242-250.
Munoz-Garcia, J., J.L. Moreno-Rebollo, and A. Pascual-Acosta. 1990. Outliers: a formal approach. International Statistical Review 58: 215-226.
Скачать презентацию на тему Data coding and screening можно ниже: