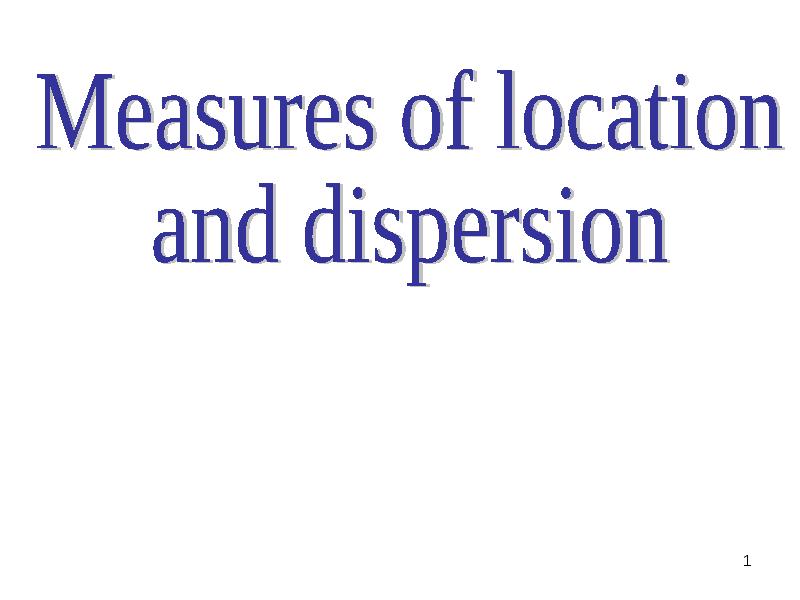
The mean values презентация
Содержание
- 2. Part 1 THE MEAN VALUES
- 3. СHAPTER QUESTIONS Measures of location Types of means Measures of location
- 7. What is the mean? The mean - is a general indicator
- 8. Statistics derive the formula of the means of the formula of
- 9. There are the following types of mean: There are the
- 10. The higher the degree of z, the greater the value of
- 11. There are two ways of calculating mean: There are two ways
- 12. Types of means
- 13. Arithmetic mean Arithmetic mean value is called the mean value of
- 14. Characteristics of the arithmetic mean The arithmetic mean has a
- 15. 2. If the data values (Xi) divided or multiplied by a
- 16. 3. If the frequency divided by a constant number, the mean
- 17. 4. Multiplying the mean for the amount of frequency equal to
- 18. 5.The sum of the deviations of the number in a data
- 19. Measures of location for ungrouped data In calculating summary values for
- 22. Example - The sales of the six largest restaurant chains are
- 23. MEDIAN for ungrouped data The median of a data is the
- 25. Position of median If n is odd: Median item
- 26. Example The median number of people treated daily at the
- 33. Is used if М = const: Is used if М =
- 34. For example: One student spends on a solution of task
- 35. Geometric mean for ungrouped data This value is used as the
- 36. Where П – the multiplication of the data value (Xi).
- 39. Example
- 40. Average seniority employee is: Average seniority employee is:
- 41. Harmonic mean for grouped data Harmonic mean - is the reciprocal
- 42. Harmonic mean for grouped data Harmonic mean is calculated by the
- 43. Example
- 44. is calculated by the formula: is calculated by the formula:
- 48. Mode is calculated by the formula: Mode is calculated by the
- 55. We substitute the data into the formula: We substitute the data
- 57. Relationship between mean, median, and mode If a distribution is symmetrical:
- 59. EXAMPLE Consider a study of the hourly wage rates in three
- 61. So we have three 100-element samples, which have the same average
- 62. The histogram for company I (left chart) is symmetric. The histogram
- 63. Knowing the median, modal and average values enables us to resolve
- 64. We obtain the following relevant indicators (measures) of asymmetry: We
- 65. Example
- 68. The weighted arithmetic mean The weighted arithmetic mean
- 69. The median
- 70. The mode
- 72. Скачать презентацию


 divided or multiplied by a")


.")


 is symmetric. The histogram")

 of asymmetry:")


Слайды и текст этой презентации
Слайд 1
Описание слайда:
Слайд 2
Описание слайда:
Part 1
THE MEAN VALUES
Слайд 3
Описание слайда:
СHAPTER QUESTIONS
Measures of location
Types of means
Measures of location for ungrouped data
- Arithmetic mean
- Harmonic mean
- Geometric mean
- Median and Mode
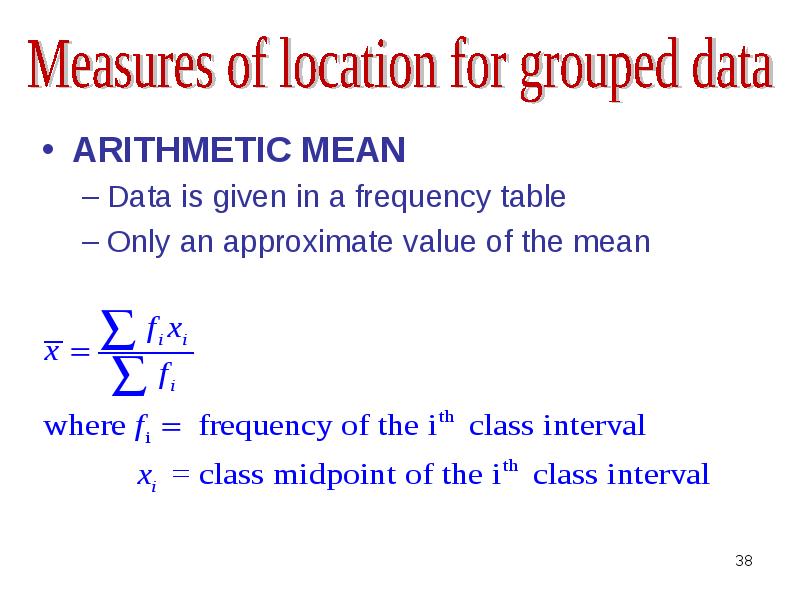
4. Measures of location for grouped data
- Arithmetic mean
- Harmonic mean
- Geometric mean
- Median and Mode
Слайд 4
Описание слайда:
Слайд 5
Описание слайда:
Слайд 6
Описание слайда:
Слайд 7
Описание слайда:
What is the mean?
The mean - is a general indicator characterizing the typical level of varying trait per unit of qualitatively homogeneous population.
Слайд 8
Описание слайда:
Statistics derive the formula of the means of the formula of mean exponential:
Statistics derive the formula of the means of the formula of mean exponential:
We introduce the following definitions
- X-bar - the symbol of the mean
Х1, Х2...Хn – measurement of a data value
f- frequency of a data values;
n – population size or sample size.
Слайд 9
Описание слайда:
There are the following types of mean:
There are the following types of mean:
If z = -1 - the harmonic mean,
z = 0 - the geometric mean,
z = +1 - arithmetic mean,
z = +2 - mean square,
z = +3 - mean cubic, etc.
Слайд 10
Описание слайда:
The higher the degree of z, the greater the value of the mean. If the characteristic values are equal, the mean is equal to this constant.
The higher the degree of z, the greater the value of the mean. If the characteristic values are equal, the mean is equal to this constant.
There is the following relation, called the rule the majorizing mean:
Слайд 11
Описание слайда:
There are two ways of calculating mean:
There are two ways of calculating mean:
for ungrouped data -
is calculated as a simple mean
for grouped data -
is calculated weighted mean
Слайд 12
Описание слайда:
Types of means
Слайд 13
Описание слайда:
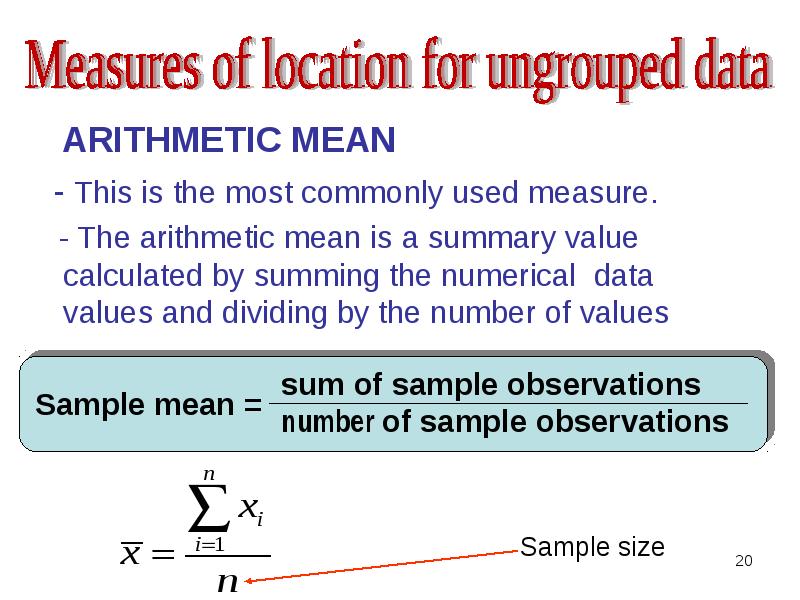
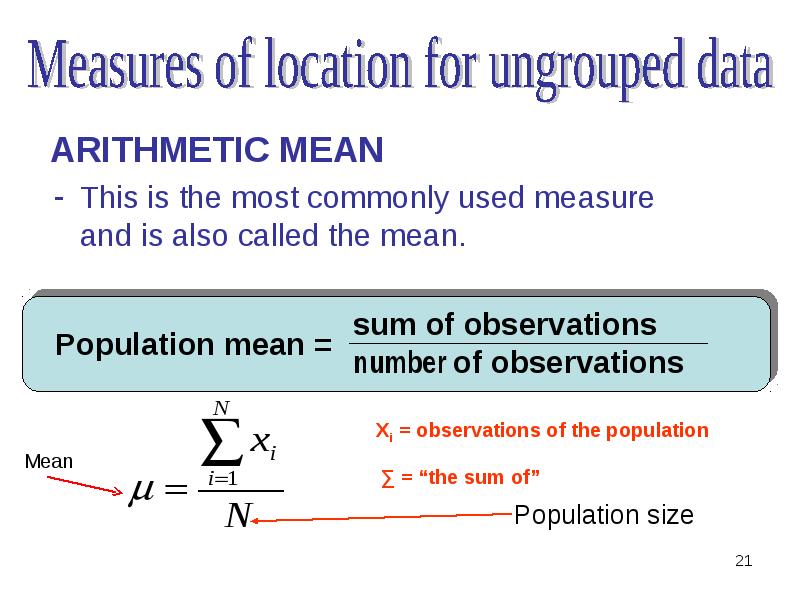
Arithmetic mean
Arithmetic mean value is called the mean value of the sign, in the calculation of the total volume of which feature in the aggregate remains unchanged
Слайд 14
Описание слайда:
Characteristics of the arithmetic mean
The arithmetic mean has a number of mathematical properties that can be used to calculate it in a simplified way.
1. If the data values (Xi) to reduce or increase by a constant number (A), the mean, respectively, decrease or increase by a same constant number (A)
Слайд 15
Описание слайда:
2. If the data values (Xi) divided or multiplied by a constant number (A), the mean decrease or increase, respectively, in the same amount of time (this feature allows you to change the frequency of specific gravities - relative frequency):
2. If the data values (Xi) divided or multiplied by a constant number (A), the mean decrease or increase, respectively, in the same amount of time (this feature allows you to change the frequency of specific gravities - relative frequency):
a) when divided by a constant number:
b) when multiplied by a constant number:
Слайд 16
Описание слайда:
3. If the frequency divided by a constant number, the mean will not change:
3. If the frequency divided by a constant number, the mean will not change:
Слайд 17
Описание слайда:
4. Multiplying the mean for the amount of frequency equal to the sum of multiplications variants on the frequency:
4. Multiplying the mean for the amount of frequency equal to the sum of multiplications variants on the frequency:
If
then the following equality holds:
Слайд 18
Описание слайда:
5.The sum of the deviations of the number in a data value from the mean is zero:
5.The sum of the deviations of the number in a data value from the mean is zero:
If
then
So
Слайд 19
Описание слайда:
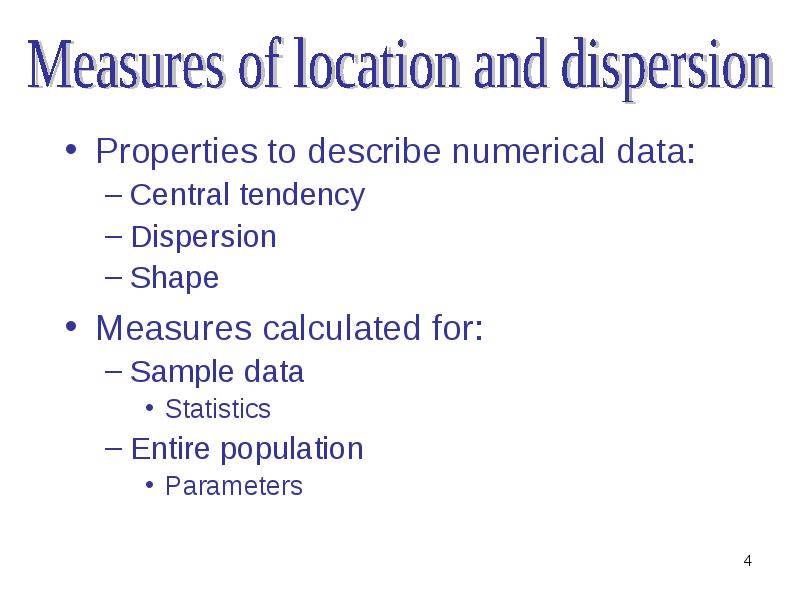
Measures of location for ungrouped data
In calculating summary values for a data collection, the best is to find a central, or typical, value for the data.
More important measures of central tendency are presented in this section:
Mean (simple or weighter)
Median and Mode
Слайд 20
Описание слайда:
Слайд 21
Описание слайда:
Слайд 22
Описание слайда:
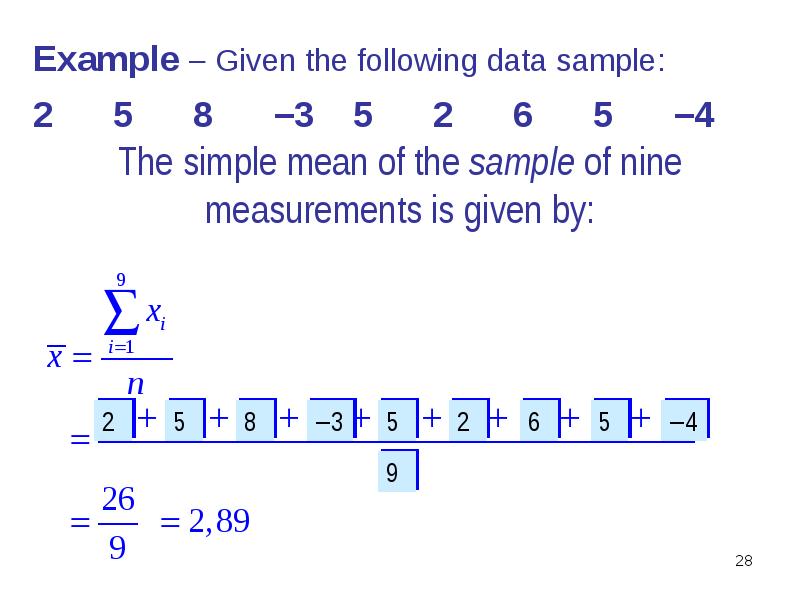
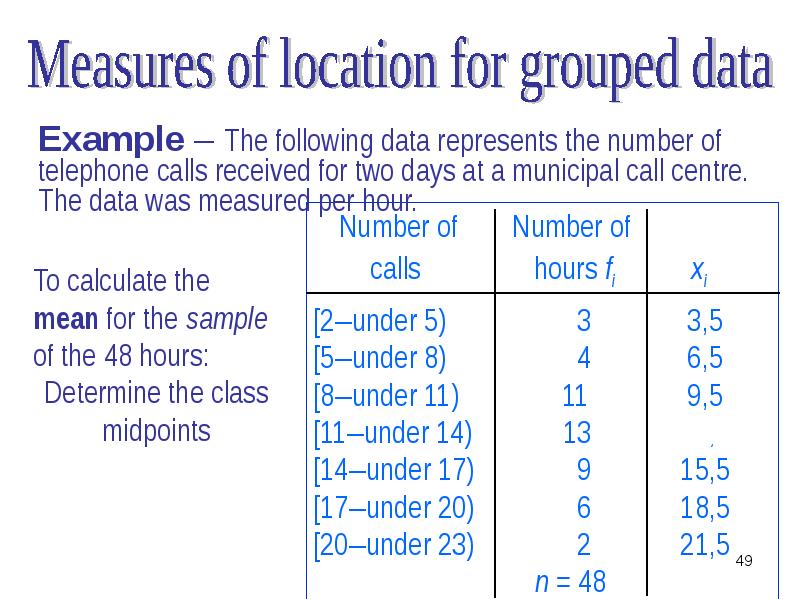
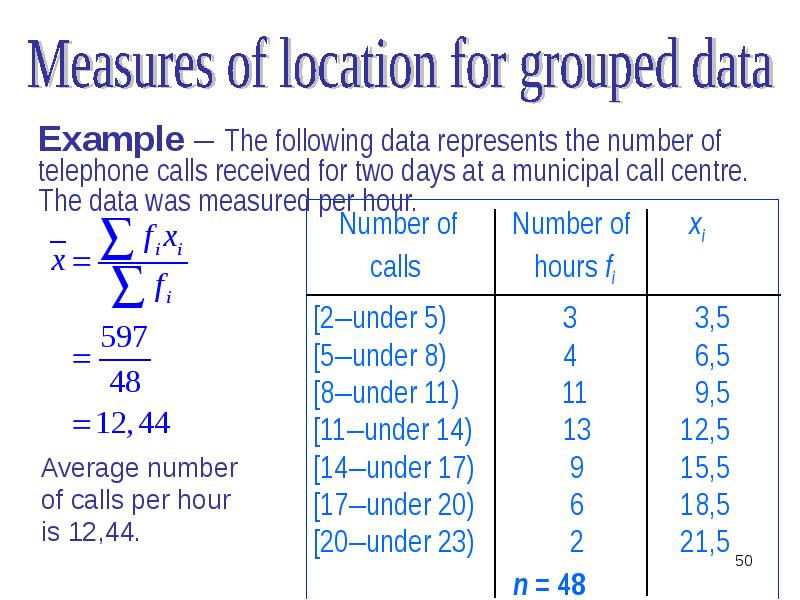
Example - The sales of the six largest restaurant chains are presented in table
Слайд 23
Описание слайда:
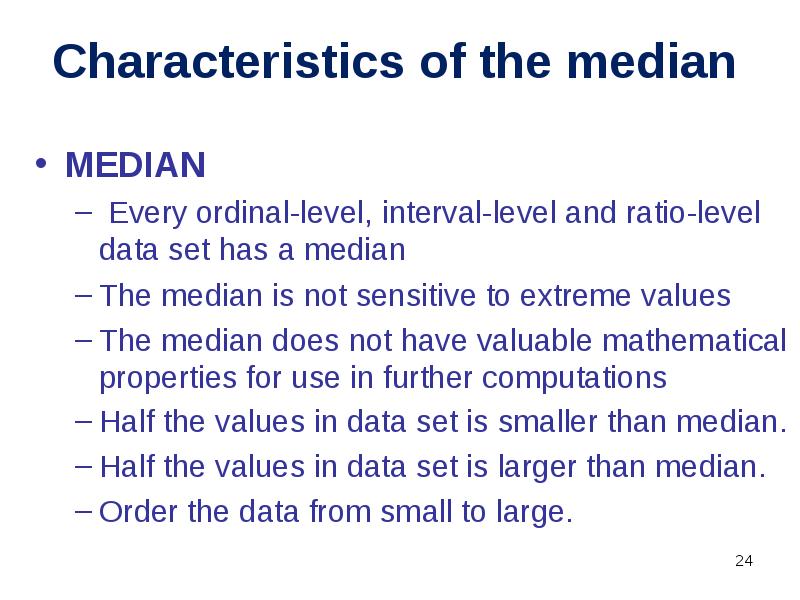
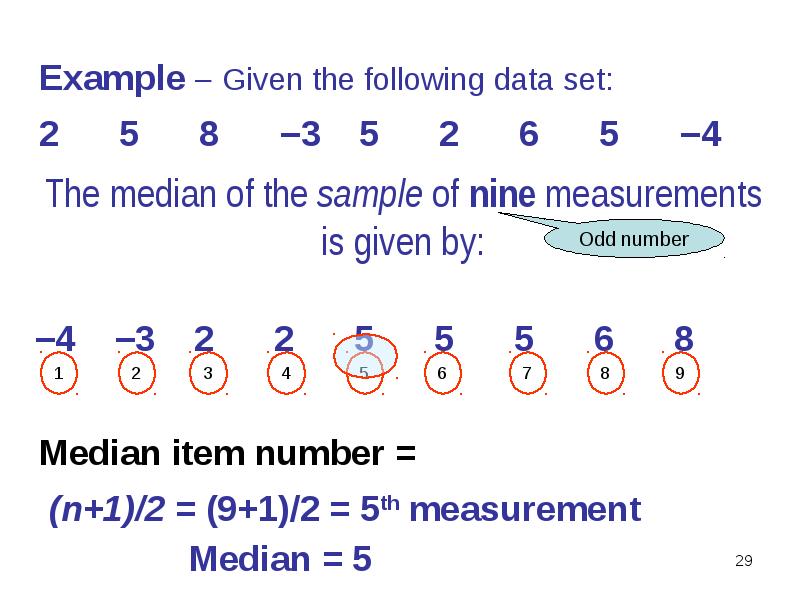
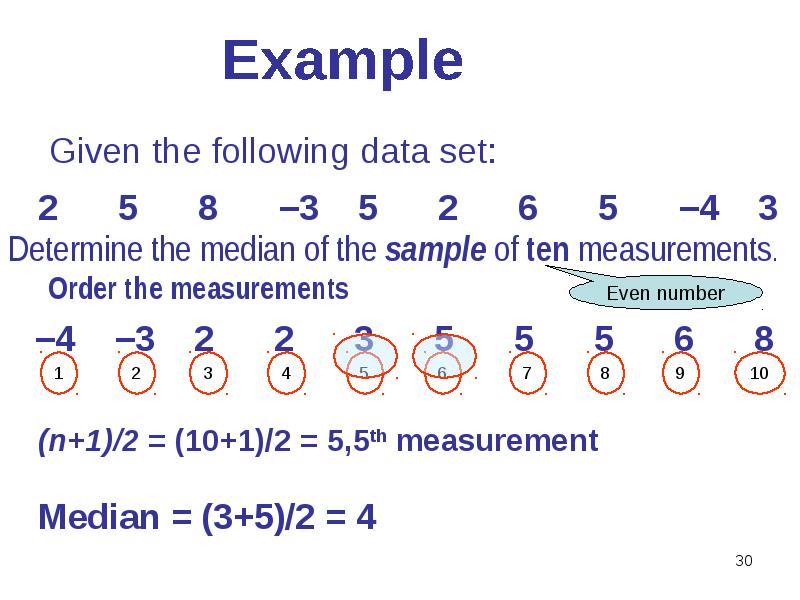
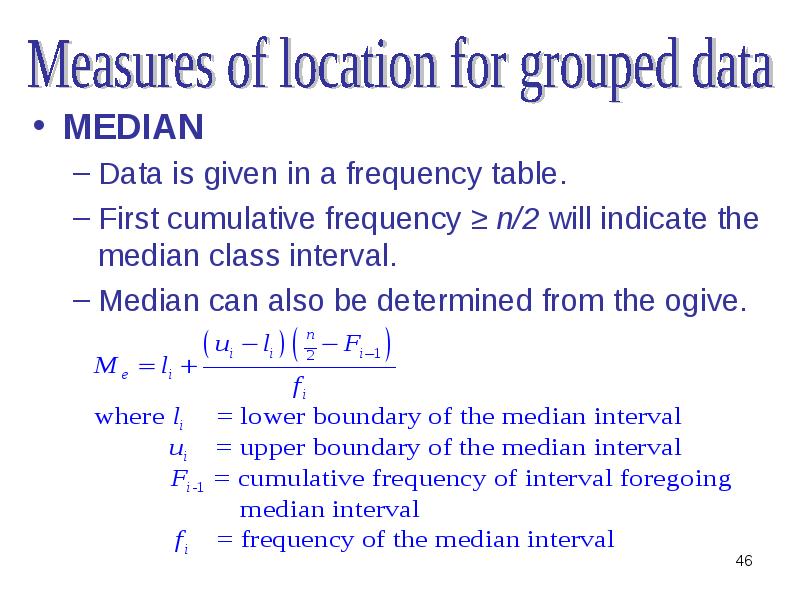
MEDIAN for ungrouped data
The median of a data is the middle item in a set of observation that are arranged in order of magnitude.
The median is the measure of location most often reported for annual income and property value data.
A few extremely large incomes or property values can inflate the mean.
Слайд 24
Описание слайда:
Слайд 25
Описание слайда:
Position of median
If n is odd:
Median item number = (n+1)/2
If n is even:
Calculate (n+1)/2
The median is the average of the values before and after (n+1)/2.
Слайд 26
Описание слайда:
Example
The median number of people treated daily at the emergency room of St. Luke’s Hospital must be determined from the following data for the last six days: 25, 26, 45, 52, 65, 78
Since the data values are arranged from lowest to highest, the median be easily found. If the data values are arranged in a mess, they must rank.
Median item number = (6+1)/2 =3,5
Since the median is item 3,5 in the array, the third and fourth elements need to be averaged: (45+52)/2=48,5. Therefore, 48,5 is the median number of patients treated in hospital emergency room during the six-day period.
Слайд 27
Описание слайда:
Слайд 28
Описание слайда:
Слайд 29
Описание слайда:
Слайд 30
Описание слайда:
Слайд 31
Описание слайда:
Слайд 32
Описание слайда:
Слайд 33
Описание слайда:
Is used if М = const:
Is used if М = const:
Harmonic mean is also called the simple mean of the inverse values .
Слайд 34
Описание слайда:
For example:
One student spends on a solution of task 1/3 hours, the second student – ¼ (quarter) and the third student 1/5 hours. Harmonic mean will be calculated:
Слайд 35
Описание слайда:
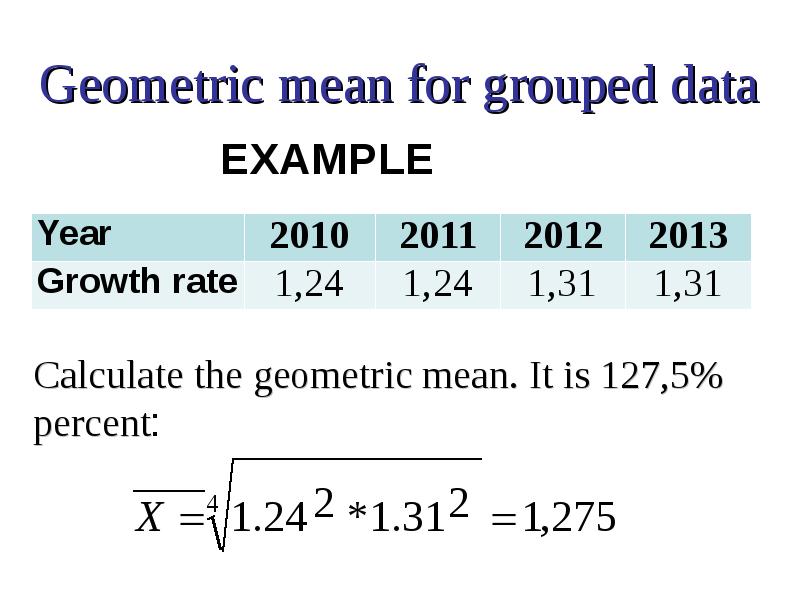
Geometric mean for ungrouped data
This value is used as the average of the relations between the two values, or in the ranks of the distributions presented in the form of a geometric progression.
Слайд 36
Описание слайда:
Where П – the multiplication of the data value (Xi).
n – power of root
Слайд 37
Описание слайда:
Слайд 38
Описание слайда:
Слайд 39
Описание слайда:
Example
Слайд 40
Описание слайда:
Average seniority employee is:
Average seniority employee is:
Слайд 41
Описание слайда:
Harmonic mean for grouped data
Harmonic mean - is the reciprocal of the arithmetic mean. Harmonic mean is used when statistical information does not contain frequencies, and presented as
xf = M.
Слайд 42
Описание слайда:
Harmonic mean for grouped data
Harmonic mean is calculated by the formula:
where M = xf
Слайд 43
Описание слайда:
Example
Слайд 44
Описание слайда:
is calculated by the formula:
is calculated by the formula:
Where fi – frequency of the data value (Xi)
П – multiplication sign.
Слайд 45
Описание слайда:
Слайд 46
Описание слайда:
Слайд 47
Описание слайда:
Слайд 48
Описание слайда:
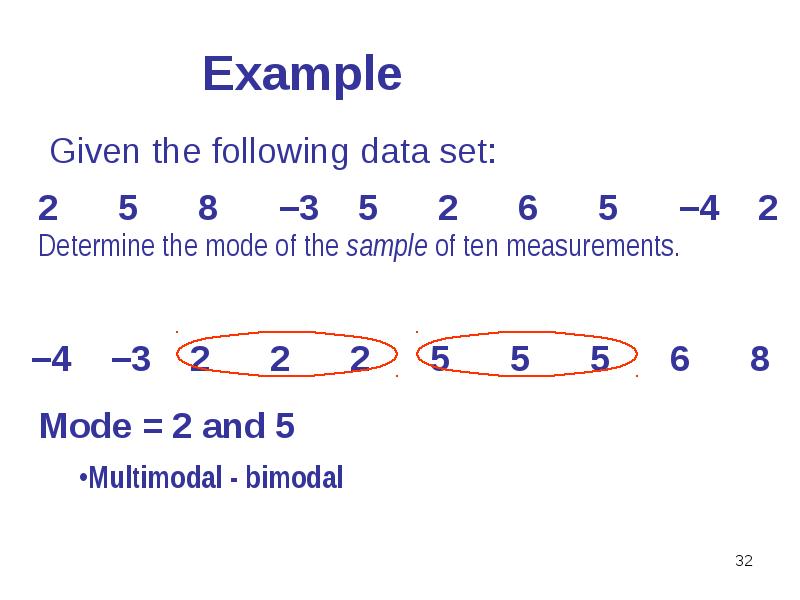
Mode is calculated by the formula:
Mode is calculated by the formula:
where хМо – lower boundary of the modal interval
i= хМо – xMo+1 - difference between the lower boundary of the modal interval and upper boundary
fMo, fMo-1, fMo+1 – frequencies of the modal interval, of interval foregoing modal interval and of interval following modal interval
Слайд 49
Описание слайда:
Слайд 50
Описание слайда:
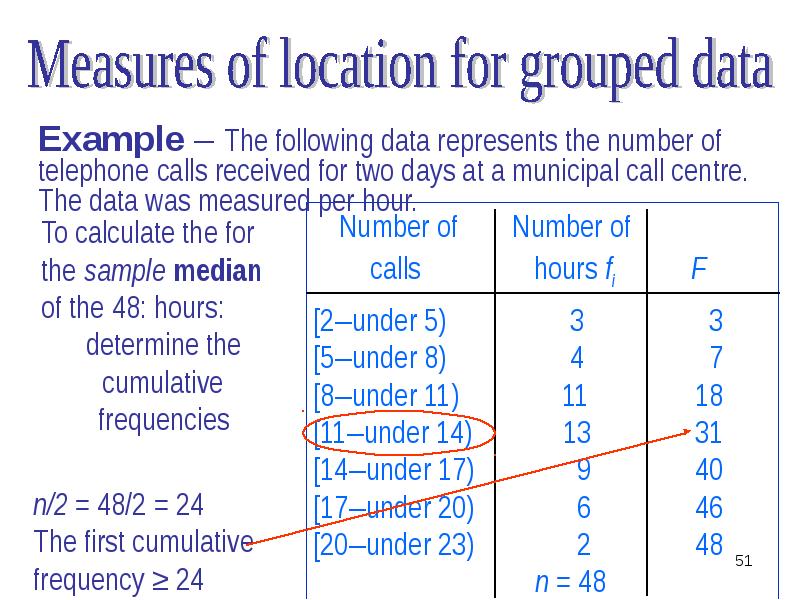
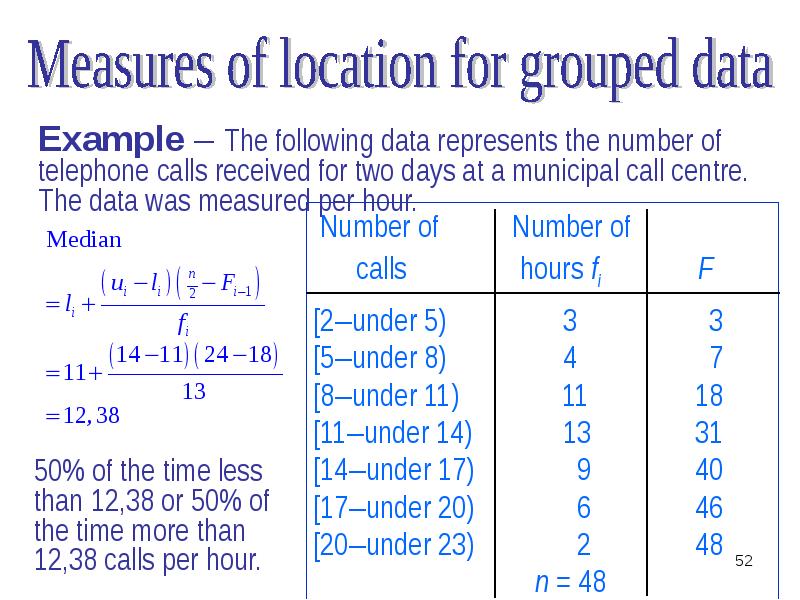
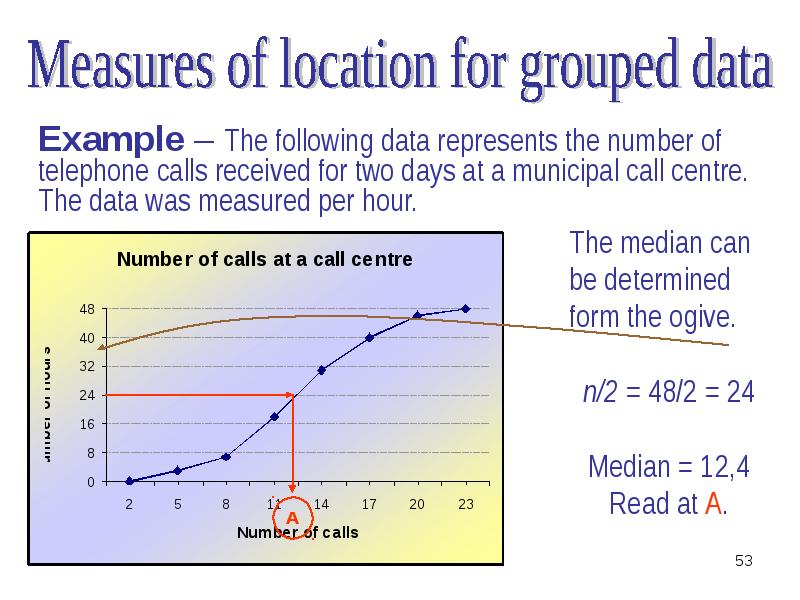
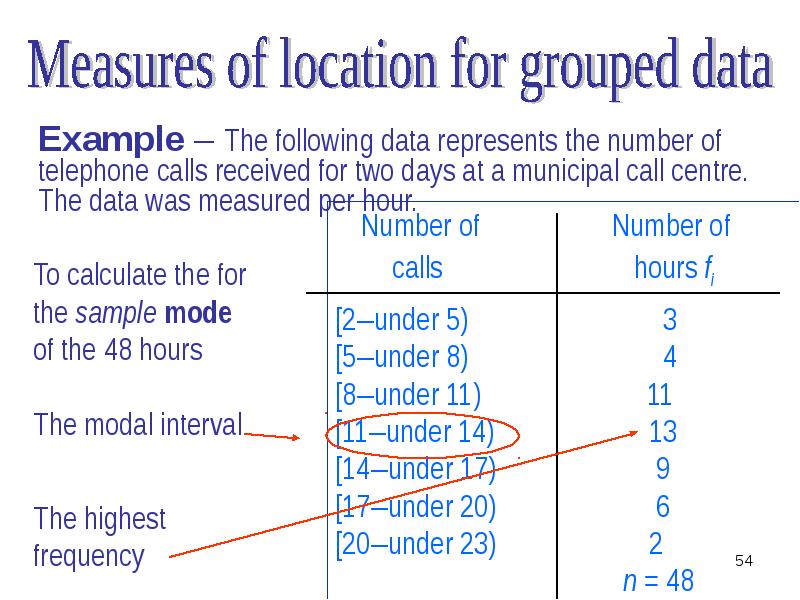
Слайд 51
Описание слайда:
Слайд 52
Описание слайда:
Слайд 53
Описание слайда:
Слайд 54
Описание слайда:
Слайд 55
Описание слайда:
We substitute the data into the formula:
We substitute the data into the formula:
Mo = 12,3
So, the most frequent number of calls per hour = 12.3
Слайд 56
Описание слайда:
Слайд 57
Описание слайда:
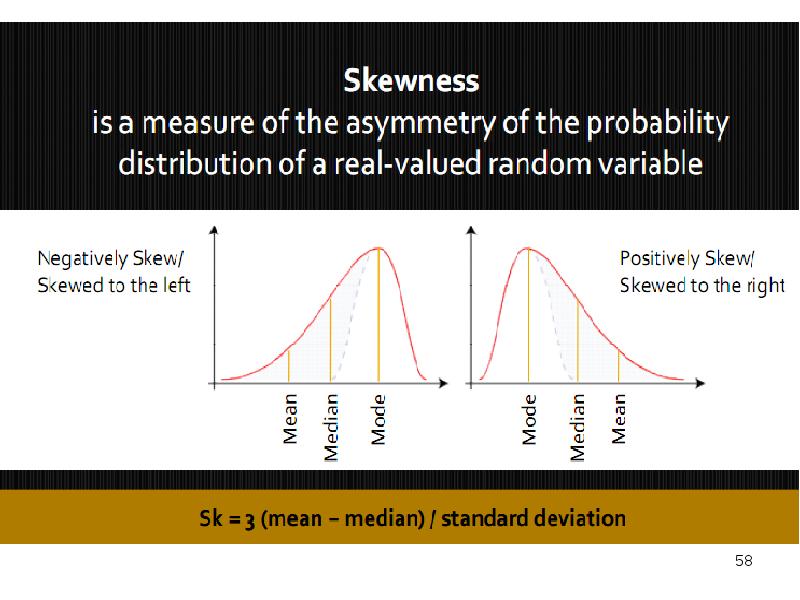
Relationship between mean, median, and mode
If a distribution is symmetrical:
the mean, median and mode are the same and lie at centre of distribution
Слайд 58
Описание слайда:
Слайд 59
Описание слайда:
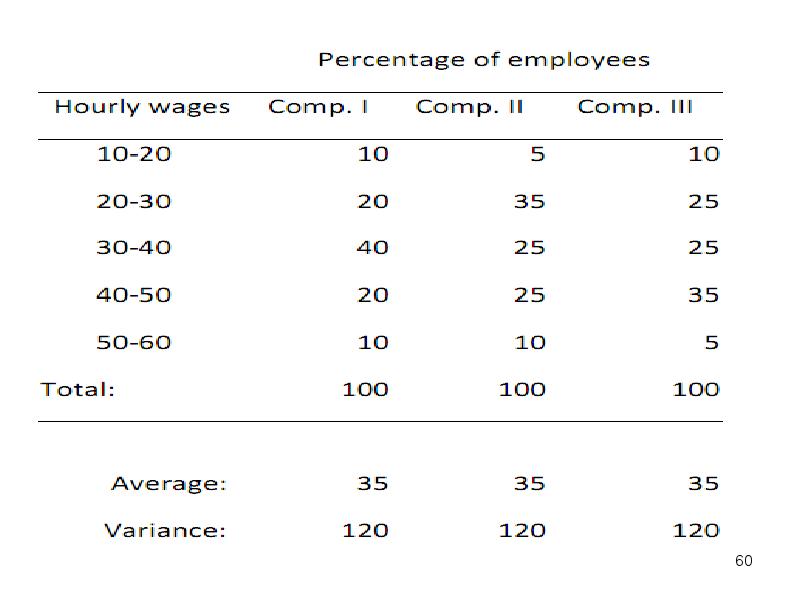
EXAMPLE
Consider a study of the hourly wage rates in three different companies, For simplicity, assume that they employ the same number of employees: 100 people.
Слайд 60
Описание слайда:
Слайд 61
Описание слайда:
So we have three 100-element samples, which have the same average value (35) and the same variability (120). But these are different samples. The diversity of these samples can be seen even better when we draw their histograms.
So we have three 100-element samples, which have the same average value (35) and the same variability (120). But these are different samples. The diversity of these samples can be seen even better when we draw their histograms.
Слайд 62
Описание слайда:
The histogram for company I (left chart) is symmetric. The histogram for company II (middle chart) is right skewed. The histogram for company III (right chart) is left skewed. It remains for us to find a way of determining the type of asymmetry (skewness) and “distinguishing” it from symmetry.
The histogram for company I (left chart) is symmetric. The histogram for company II (middle chart) is right skewed. The histogram for company III (right chart) is left skewed. It remains for us to find a way of determining the type of asymmetry (skewness) and “distinguishing” it from symmetry.
Слайд 63
Описание слайда:
Knowing the median, modal and average values enables us to resolve the problem regarding the symmetry of the distribution of the sample. Hence,
Knowing the median, modal and average values enables us to resolve the problem regarding the symmetry of the distribution of the sample. Hence,
For symmetrical distributions:
x = Me = Mo ,
For right skewed distributions:
x > Me > Mo
For left skewed distributions:
x < Me < Mo .
Слайд 64
Описание слайда:
We obtain the following relevant indicators (measures) of asymmetry:
We obtain the following relevant indicators (measures) of asymmetry:
Index of skewness: ;
Standardized skewness ratio:
Coefficient of asymmetry
Слайд 65
Описание слайда:
Example
Слайд 66
Описание слайда:
Слайд 67
Описание слайда:
Слайд 68
Описание слайда:
The weighted arithmetic mean
The weighted arithmetic mean
Слайд 69
Описание слайда:
The median
Слайд 70
Описание слайда:
The mode
Слайд 71
Описание слайда:
Скачать презентацию на тему The mean values можно ниже: