OPEC. Outline. Basic Facts презентация
Содержание
- 2. Outline Basic Facts on OPEC Influence of OPEC Production of OPEC
- 3. Basic Facts OPEC was formed in Baghdad in 1960 to coordinate
- 4. How OPEC Exerts its Influence OPEC sets individual production quotas for
- 6. Middle East Although OPEC is not an organization of Middle Eastern
- 9. Production from OPEC Countries
- 11. Revenues of OPEC Nations
- 13. Summary While OPEC still has considerable influence in determining the price
- 14. OPEC and the U.S. As I touched upon in my first
- 15. Major Sources of U.S. Petroleum Imports (2001)
- 16. Comparison of U.S. Oil Imports
- 17. Assuring Independence from OPEC Imports ~ Drilling in the ANWR- Screw
- 20. Conclusion OPEC still has considerable influence in determining the price per
- 21. Скачать презентацию


")


Слайды и текст этой презентации
Слайд 1
Описание слайда:
OPEC
Слайд 2
Описание слайда:
Outline
Basic Facts on OPEC
Influence of OPEC
Production of OPEC
Revenue of OPEC
Summary
OPEC and the U.S.
Ways for U.S. to Rid of Dependence on OPEC Oil Imports
Conclusion
Слайд 3
Описание слайда:
Basic Facts
OPEC was formed in Baghdad in 1960 to coordinate and unify the policies of petroleum exporting nations
The main objective of OPEC is to ensure the “stabilization of oil prices in international markets” and securing a steady income to oil producing nations
In order to achieve these objectives, the OPEC nations meet at least bi-annually to decide whether to raise or lower their collective oil production in order to maintain “stable” prices
The main factors in their formulating of petroleum policy are the forecasts for economic growth rates and petroleum demand and supply
The 11 OPEC member countries produce about 40% of the world’s crude oil, and therefore have a strong influence on the oil market
At the end of 2001, OPEC had reserves of nearly 850 billion barrels of crude oil, representing nearly 80% of the world total of over 1 trillion barrels
Слайд 4
Описание слайда:
How OPEC Exerts its Influence
OPEC sets individual production quotas for each member country that serve as “production targets” to ensure that there supply isn’t greater than demand
These “production targets” for each country add up to a “ceiling” that OPEC desires not to exceed (However they rarely stay under their proposed ceiling)
The graph to the right shows the quota set by OPEC for the millions of barrels to be produced per day during Oct. 22 compared to the actual amount. (As you can see, the quota has been surpassed by over 3 million barrels per day)
Iraq is not included in the quota system because their exports are controlled by the U.N. based on the “food for oil” program
Слайд 5
Описание слайда:
Слайд 6
Описание слайда:
Middle East
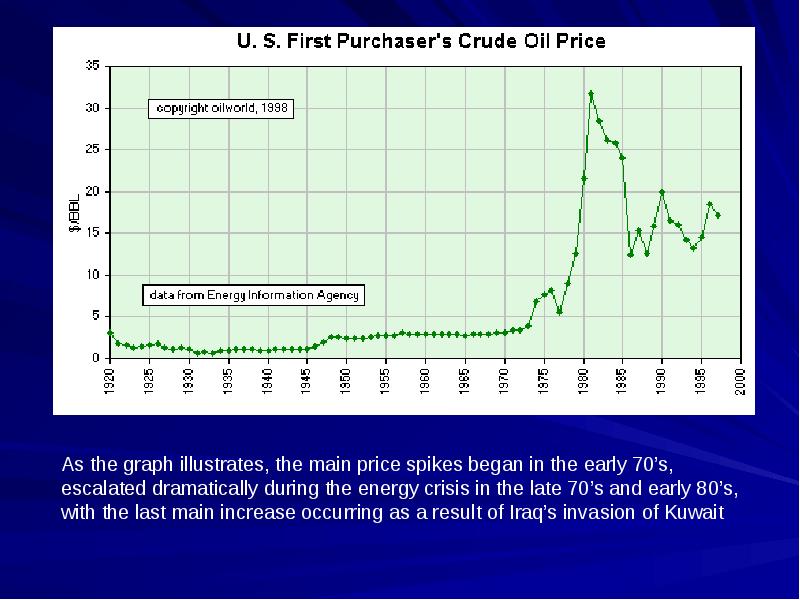
Although OPEC is not an organization of Middle Eastern oil producers, the politics of the Middle East and in particular the Persian Gulf have played and continue to play a dominant role in the policies OPEC decides upon
There have been three main price spikes in world oil prices, all of which were due to unrest in the Middle East with OPEC not increasing quotas enough to compensate:
In the early 1970’s oil prices spiked as Arab oil producers embargoed oil deliveries to countries friendly to Israel
In 1979, prices soared again as Iranian oil workers went on strike in support of the Islamic Revolution, and high prices continued in the early 80’s during the Iran/Iraq War
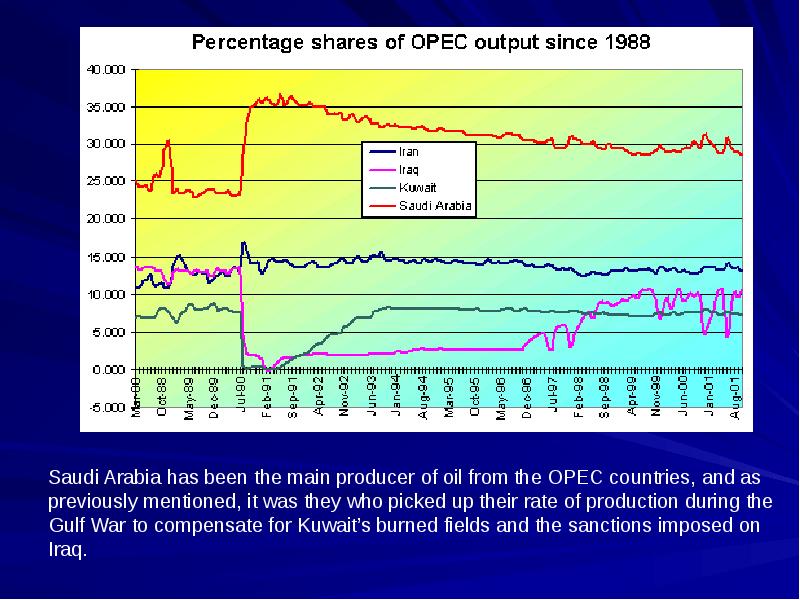
In 1990 when Iraq invaded Kuwait, oil exports from Kuwait were severely diminished from the burning of their oil fields and the imposing of sanctions on oil exports from Iraq ( In this instance Saudi Arabia did pick up the slack substantially )
Слайд 7
Описание слайда:
Слайд 8
Описание слайда:
Слайд 9
Описание слайда:
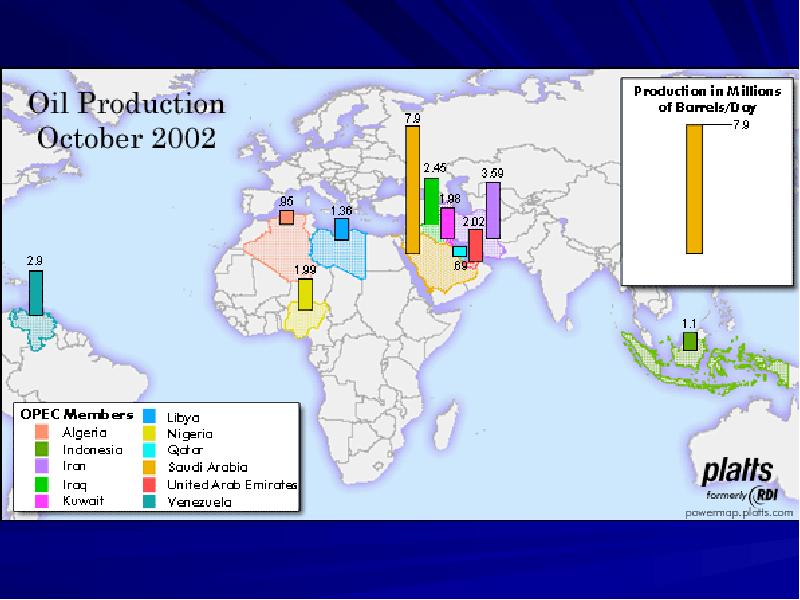
Production from OPEC Countries
Слайд 10
Описание слайда:
Слайд 11
Описание слайда:
Revenues of OPEC Nations
Слайд 12
Описание слайда:
Слайд 13
Описание слайда:
Summary
While OPEC still has considerable influence in determining the price per barrel of petroleum by restricting output, their success has greatly diminished since the 1970’s
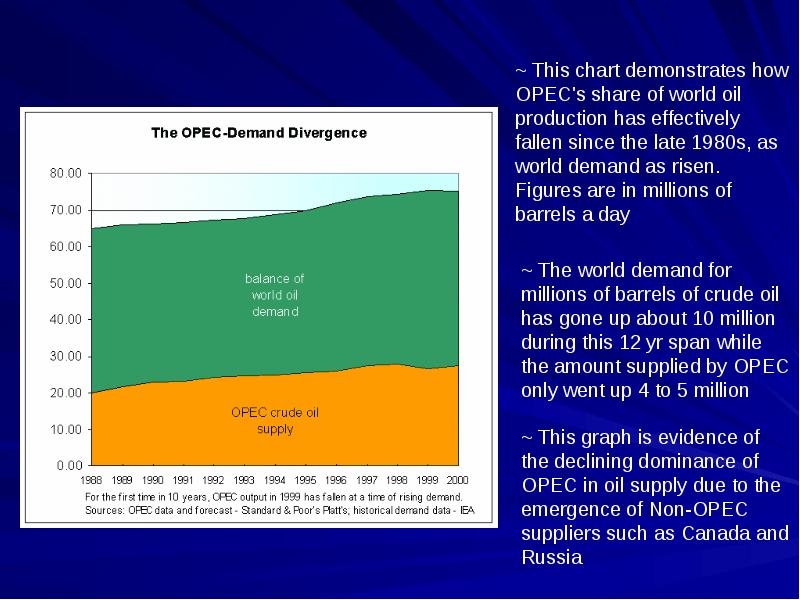
Despite the overall increase in worldwide demand for petroleum, OPEC nations have not received the brunt of this increased demand. Rather, it has gone to Non-OPEC nations
As a result, over the past few years both production and revenues in the OPEC nations have declined significantly
Successful oil production in the OPEC nations is tied to the political and economic status of the volatile Middle East, which serves as a deterrent to potential importers
Слайд 14
Описание слайда:
OPEC and the U.S.
As I touched upon in my first presentation, the United States consumes nearly 7 billion barrels of oil annually
The U.S. imports over half of these 7 billion barrels, with half of these imports coming from OPEC nations
The amount of these imports is only going to increase in the future as the nearly depleted U.S. reserves begin to run out
Some numbers for you math lovers of course:
~ 1998 U.S. oil imports- $50 Billion ~ Approx. $25 Billion to OPEC nations
~ 1999 U.S. oil imports- $67 Billion ~ Approx. $34 Billion to OPEC nations
~ 2000 U.S. oil imports- $119 Billion ~ Approx. $60 Billion to OPEC nations
Слайд 15
Описание слайда:
Major Sources of U.S. Petroleum Imports (2001)
Слайд 16
Описание слайда:
Comparison of U.S. Oil Imports
Слайд 17
Описание слайда:
Assuring Independence from OPEC Imports
~ Drilling in the ANWR- Screw the caribou!
~ No seriously, attempting to improve domestic production of oil won’t decrease our dependence on foreign imports, any gains in domestic production would be trivial compared to possible gains through efficiency
~ Congress raising fuel economy standards with car standards= to SUV
~ Eventually set a 40 mpg standard that would save 50 Billion barrels of oil over 50 yrs
~ Castrating Ronald Reagan for rolling back the impressive CAFÉ standards that put us on the path to oblivion otherwise disguised as today!
~ Other smaller efficiency measures such as:
~ Carpooling ~ Improving public transportation ~ More research in hybrid tech’s
Слайд 18
Описание слайда:
Слайд 19
Описание слайда:
Слайд 20
Описание слайда:
Conclusion
OPEC still has considerable influence in determining the price per barrel of petroleum by setting quotas, but their best days are behind them
Non-OPEC nations such as Canada and Mexico have stripped the cartel of its power to single-handedly manipulate the petroleum market
The U.S. has benefited from the increased production of petroleum by Non-OPEC nations and thus reduced their annual imports from the OPEC countries in recent years
The United States needs to address its unacceptable energy policy by stressing efficiency and reduced demand for fossil fuels
Скачать презентацию на тему OPEC. Outline. Basic Facts можно ниже: